Monthly S&P500 Emini futures candlestick chart: Almost to EMA
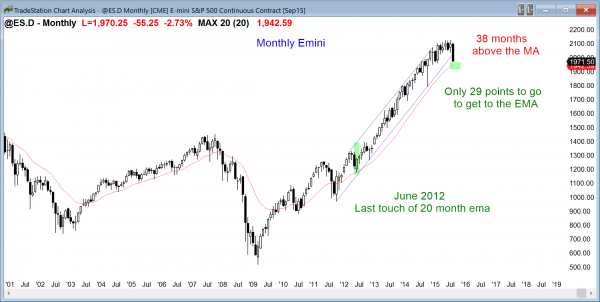
The monthly S&P500 Emini futures candlestick chart is now only about 30 points above its moving average. I have been saying that there was an 80% chance of it penetrating the moving average this year, and it will probably happen this month or next, and possibly next week.
The monthly S&P500 Emini futures candlestick chart reversed down strongly this week and is only 29 points away from the target of the monthly moving average. The odds are that it will fall below the average, but it is too early to know the extent of the selling. Since it has not touched the moving average in more than 20 bars, there will be buyers there. When the bulls are so eager to buy that they continue to buy well above an average price, there are always bulls willing to buy once the market falls to an average price.
However, the buy climax was so extreme that it is unlikely that the pullback will only last a month or two. When a market reverses down from an extreme buy climax like this, my general rule is to look for at least TBTL, which is Ten Bars and Two Legs, sideways to down. Ten bars on the monthly chart is 10 months, so even if there is a bounce around the moving average and the selling stops there, the odds are that the best the bulls get is a trading range for at least several more months.
The monthly moving average is still strongly up. Even if the monthly chart sells off for a year and the daily chart falls 20% or more, the selloff will probably just create a bull flag on the monthly chart. Yes, it is a major reversal on the daily chart, but it is only a minor reversal on the monthly chart, and a trading range on the monthly chart is more likely than a bear trend.
Even if there is a bear trend over the next 2 – 3 years, it will probably have to have a major trend reversal first. This means that the selloff will probably last 10 or more bars and then be followed by a rally lasting 10 or more bars. That would take a couple of years. At that point, there might be a lower high major trend reversal. Sometimes the market can reverse down far and for many months without first creating a major top. This is unlikely. The odds favor a strong rally to about 50% of the selloff before the bears have a reasonable chance of a deep reversal down.
Weekly S&P500 Emini futures candlestick chart: Big bear breakout below tight trading range and bull trend line
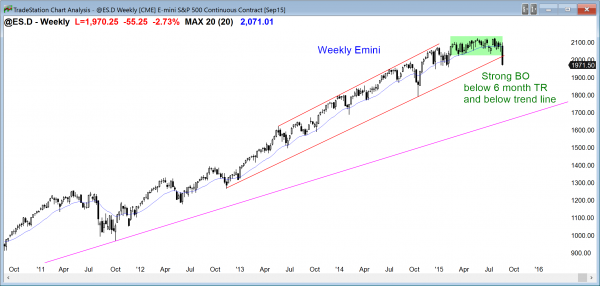
The weekly S&P500 Emini futures candlestick chart broke strongly out of its 7 month tight trading range. The minimum target is at least a measured move down.
The weekly S&P500 Emini futures candlestick chart had a strong bear breakout this week below its 7 month tight trading range and below its bull trend line of the past 2 years. The bears need a follow-through bear bar on the weekly chart to confirm the bear breakout. The breakout bar this week is big enough to make the odds favor follow-through selling for at least several more weeks.
Daily S&P500 Emini futures candlestick chart: Learn how to trade the markets in a bear trend
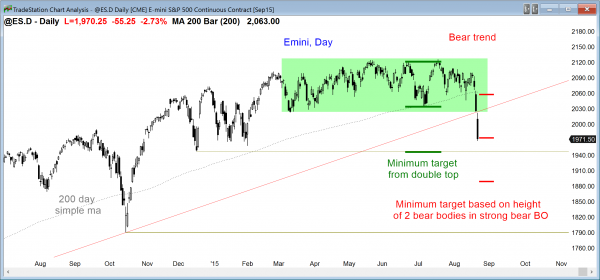
The daily S&P500 Emini futures candlestick chart had a strong bear breakout with a follow-through day on Friday. It is in a bear trend.
The daily S&P500 Emini futures candlestick chart had two big bear bars and a breakout below the 7 month trading range. When bars are that big and the context is supportive of a breakout, there is at least a 60% chance of at least a measured move down. Any big breakout can be an exhaustion gap and the end of a bear leg. While this is possible, given the context (a 7 month trading range in an overbought bull trend on the monthly chart) and the size of the two bars, this is much more likely the start of a swing down than the end.
A reasonable minimum target is a measured move based on the height of the bodies of the two big breakout bars. This means the the Emini is likely to fall at least 85 points below Friday’s close before it rallies 85 points to above Thursday’s high. The measured move often comes in the form of a wedge bear channel with 3 pushes down. The first push down is the bear breakout, which either ended on Friday or it will end early next week.
Another measured move target is based on the height of the 7 month trading range. That projects down to the December low, which is only about 25 points below and it is near the monthly moving average, which is the minimum monthly target.
I have been saying all year that the upside was limited, and there was at least an 80% chance of a test of the monthly moving average. I have also said that there is about a 50% chance of the October low. Nothing has changed. Traders always have to be aware that the exact opposite of what they believe is likely can happen. The chance that this is a failed bear breakout is probably only 30 – 40%.
The odds are that there are trapped bulls who failed to believe that the breakout would be this strong, and they will use the first rally to sell out with a smaller loss. Also, many bears waited for evidence that the probability for shorts was high. They know have that evidence. They, too, will sell the first rally, but they will sell to put on shorts. With the selloff as climactic as it has been, the Emini could easily rally 50 more points before the next leg down begins. However, the odds are high that there will be at least one more leg down.
Traders learning how to trade the markets have to realize that bear trends often have surprisingly strong rallies. This bear trend will, as well. Do not begin to think that the strong reversal up is the start of a bull trend. It will more likely be a bull trap (a bear flag and a lower high) that will be followed by another leg down. The strategy for the next several weeks, and maybe months, is to sell rallies. It is far better to ignore the professorial pundits on TV who say that this is a buying opportunity. Remember, these were the same experts who have been showing charts on CNBC as recently as this week that they confidently said strongly pointed to a rally of more than 100 points. They were wrong then and are even more wrong now. The bears own the market until the bulls can create a strong base, like a major trend reversal or a wedge bottom. That would take at least 20 bars, which is at least 3 weeks. It probably will take much longer before it makes sense to consider buying.
Traders can see the end of the day bar-by-bar price action report by signing up for free at BrooksPriceAction.com. I talk about the detailed Emini price action real-time throughout the day in the BrooksPriceAction.com trading room, and a 2 day free trial is available.
When I mention time, it is USA Pacific Standard Time (the Emini day session opens at 6:30 am PST, and closes at 1:15 pm PST). You can read background information on the intraday market reports on the Intraday Market Update page.


