Monthly S&P500 Emini futures candlestick chart: Learn how to trade a doji candlestick pattern
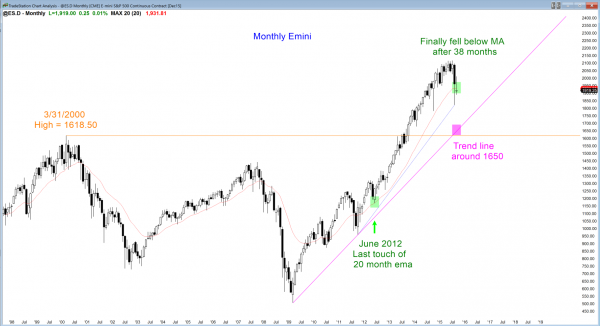
The monthly S&P500 Emini futures candlestick chart closes on Wednesday. It is currently a doji at the monthly moving average, but that might change early next week.
The monthly S&P500 Emini futures candlestick chart is neutral going into next week. Bulls see this as the first pullback to the moving average in 38 months, and a great opportunity to buy at an average price. They have only been able to buy at an above average price for several years. Bears see 38 months above the moving average as extreme, unsustainable behavior. They believe that the upside over the next 5 – 10 months is limited, and that there could easily be a test down to the bull trend line and the March 2000 high, both of which are below 1700 and more than 20% below the all-time high.
The only 2 other times in the past 50 years when the S&P cash index held above its monthly moving average for 38 months were in 1998 and in 1987. Those were followed by 22% and 36% corrections, and the bears hope fore something similar this time. They also believe that there is a 50% chance that the pullback will test below last October low. Both the bulls and bears have valid interpretations, and when that is the case, the Emini usually goes sideways, at least for a while. However, the bear breakout on the daily chart was so exceptionally strong that the odds favor at least one more leg down on the daily chart.
Weekly S&P500 Emini futures candlestick chart: Weak entry bar for the bears who sold below last week’s reversal bar
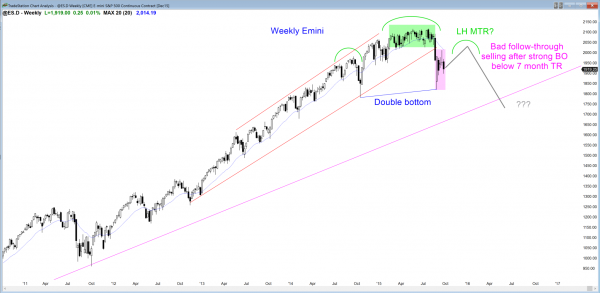
The weekly S&P500 Emini futures candlestick chart had a weak entry bar for the bears who this week sold the breakout below the bear flag of the past 4 weeks.
The weekly S&P500 Emini futures candlestick chart is neutral. The prior 2 weeks were doji candlestick patterns and they followed a strong reversal up from a huge sell climax. A continued tight trading range is likely. If the bulls are able to rally back up to the moving average, the bears will look for the rally to fail to get above the July high. They will then sell the lower high, expecting the head and shoulders top bear flag to break below its neckline at around 1980, and then fall for a measured move down. This would be a lower high major trend reversal.
That neckline is the bottom of the double bottom created by the July collapse and last October’s low. The bulls hope for a continued rally up from that double bottom, a breakout above the July high, which is the neckline of the double bottom, and then a new all-time high. They have a 40% chance of that happening before a test of last October’s low.
Daily S&P500 Emini futures candlestick chart: Bear flag continues to add bars
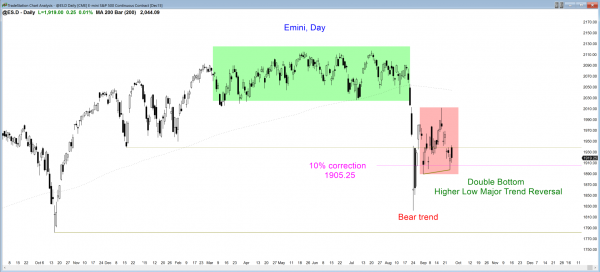
The daily S&P500 Emini futures candlestick chart had a weak bounce from its test of the September 1 low. It might have to test it one more time next week before the bulls become confident that they have won and that the Emini will rally for a week or so.
The daily S&P500 Emini futures candlestick chart is in a trading range in a bear trend. The sell climax and the reversal up in August were exceptionally strong. The result is that the Emini is in balance, and it might remain that way for many months, although it is more likely to break out within the next month or two.
The selloff was so exceptional that the daily chart is in a bear trend. It has a 60% chance of at least one more leg down before it can rally to test the all-time high. If the bulls win, there is a 60% chance that the breakout to a new all time high will be sold and that the Emini would reverse down from a higher high major trend reversal within a few weeks of the breakout.
If the trading range continues for another month, the probability of a bear breakout will shrink from its current 60%. At some point, the probability will fall to about 50% for the bulls and bears because the effect of the huge bear breakout will dwindle as it fades further into the past. For the time being, the bears have the edge, which means that the daily chart is in a bear trend as far as traders are concerned, even if it has not fallen the 20% needed for the news to declare a bear trend.
Both bulls and bears are eager for the trading range to end, but both are taking fast profits because they know that it is more likely to continue and that swings up and down will remain brief. At some point, there will be a strong breakout. It might last only a few days, or it might be a weak channel that could continue for months.
However it unfolds will be difficult because all trading is difficult. Traders who are comfortable with whatever happens are in the best position to make money. They will trade what is in front of them and not worry about what they might have preferred to see. They will not fight the market, and instead not question what happens. If it goes up, they will buy. If it goes down, they will sell. It does not matter what any pundit claims is the reason. His opinion is meaningless. All that matters is what the market is doing, and that is all traders should ever consider.
Traders can see the end of the day bar-by-bar price action report by signing up for free at BrooksPriceAction.com. I talk about the detailed Emini price action real-time throughout the day in the BrooksPriceAction.com trading room, and a 2 day free trial is available.
When I mention time, it is USA Pacific Standard Time (the Emini day session opens at 6:30 am PST, and closes at 1:15 pm PST). You can read background information on the intraday market reports on the Intraday Market Update page.


