Market Overview: S&P 500 Emini futures
The S&P 500 Emini futures pause after testing the February 2 high this week on the weekly chart pulling back slightly to close below it. The bulls hope that this is simply a pause before the trend resumes higher to test the January high. The bears want the Emini to stall around February 2 high and reverse lower from a double top bear flag.
S&P 500 Emini futures
The Monthly S&P Emini chart

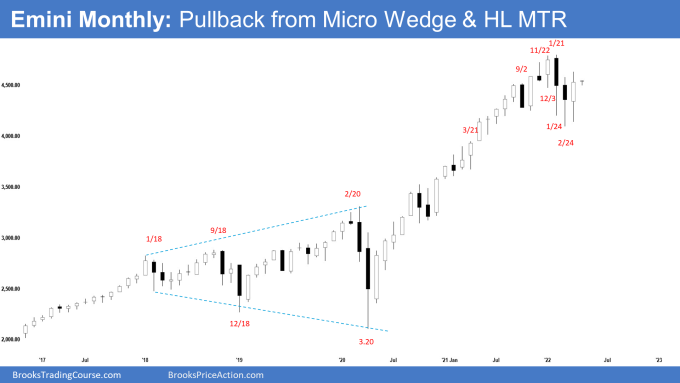
- The March monthly Emini candlestick was a bull bar with a long tail above and below, closing in the upper half of the range.
- We have said that in February a weak sell signal bar and selling below a weak sell signal bar at the bottom of a developing 8-month trading range is not an ideal sell setup. Odds are there will be buyers below. The bulls see the January – February selloff as a long-overdue pullback. They want a reversal higher from a micro wedge bull flag (December 3, January 24, February 24) or a double bottom bull flag with the May 2021 or June 2021 low and a retest of the trend extreme followed by a subsequent breakout to a new high.
- Al has said that due to the back-to-back OO, traders should expect a break below the January low before a break above the January high and the selloff would probably last 2 to 3 months. The sell-off lasted for 2 months plus.
- Al also said that there is a 50% chance that the February 24 low will be the low of the year and March and April form a pair of consecutive months that is the most bullish of the year, and therefore the Emini is entering a timeframe that has an upward bias. This remains true.
- While March closed as a bull bar and traded above February triggering the high 1 buy entry, it closed below February high and has a prominent tail above. It is not a very strong bull signal bar.
- Bulls want this to be the start of the re-test of the trend extreme followed by a breakout to a new high. The bulls will need to close April as another follow-through bar to increase the odds of testing the January high.
- Bears hope this is simply a pullback from the 2-months correction and want a reversal lower from a lower high or a double top with January high. The bears want a break below the February low followed by a measured move down to around 3600 based on the height of the 7-month trading range. However, since March has a good size bull body and a long tail below, it is a weak sell signal bar for a strong reversal down.
- The Emini has been in a trading range for 8 months. Odds are that the trading range will continue rather than a strong breakout from either direction.
- The bull trend on the monthly chart has been very strong. Even if it sells off for a 10 to 20% correction, that would still only be a pullback on the monthly chart (even though it could be a bear trend on the daily chart) and not continue straight down into a bear trend.
- The best the bears will probably get on the monthly chart is a trading range for many months to around a 20% correction down to the gap on the monthly chart below April 2021 low and around the 4,000 Big Round Number.
- For now, odds slightly favor sideways to up for a few weeks more.
The Weekly S&P 500 Emini chart

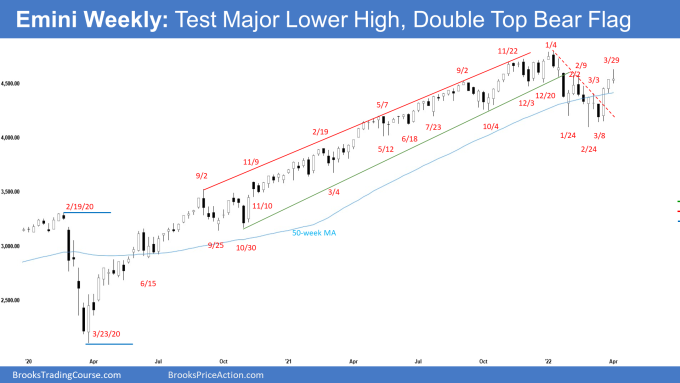
- This week’s Emini weekly candlestick was a bull doji with a long tail above
- Last week, we said that since there was a strong bull follow-through bar closing near its high, odds slightly favor sideways to up. Since the February 2 high is less than 50 points above Friday’s close, we may even reach it early in the week.
- If next week trades higher but reverses and closes as a bear bar near the low, traders will start wondering if this will lead to a reversal from a double top bear flag.
- Bears want the Emini to stall around February 2 high and reverse lower from a double top bear flag. They want next week to have a bear body, even though the Emini may trade higher first.
- This week traded above February 2 high early in the week but closed below it. While it did not close as a bear bar near the low, it was not a strong close for the bulls.
- Bulls hope that this move up is the start of the reversal to re-test the trend extreme followed by a new high. They want consecutive bull bars closing near their highs, like the one from October 4 low. There is a 4-bar bull micro channel currently.
- The bulls hope that this week was simply a pause before the trend resumes higher, even if there is a small pullback first in the next 1-2 weeks.
- The bears hope that this leg up is simply a pullback (bounce) from the 2-month correction. They want the Emini to stall around February 2 high and reverse lower from a double top bear flag. They want next week to be a big bear bar closing near the low. If they get that, the odds of a reversal lower from a double top bear flag (February 2 and March 29) increase.
- The bears want a strong break below the February 24 low which is the neckline of the double top bear flag and a measured move down towards 3600 based on the high of the 8-month trading range.
- Al said that if the bears get the breakout below February 24 low (only a 30% chance currently), it will follow 3 strong reversals up (wedge bull flag). There would be a lot of trapped bulls because everyone expected higher prices. It would likely lead to a 50% chance of a fast sell-off for about a 500-point measured move down to 3600 based on the height of the 7-month trading range. This remains true.
- So, which is more likely? A pullback and a continuation higher or a double top bear flag and a reversal lower?
- The Emini is currently trading around the middle of the 8-month trading range. Lack of clarity is the hallmark of a trading range. Odds are, the current move up is a bull leg within a trading range, and sellers will return when the Emini moves towards the January high.
- Since this week was a bull doji and it followed 2 strong bull bars closing near their highs, it is not a strong sell setup for next week. The bears will need at least a micro double top or a strong sell signal bar before they would be willing to sell aggressively.
- For now, odds slightly favor sideways to up after a small pullback.
- However, if the bears get consecutive bears bar closing near the low, odds will swing in favor of a test of the February low and possibly a breakout below.
Trading room
Traders can see the end of the day bar-by-bar price action report by signing up for free at BrooksPriceAction.com. I talk about the detailed Emini price action real-time throughout the day in the BrooksPriceAction.com trading room. We offer a 2 day free trial.
Market analysis reports archive
You can access all reports on the Market Analysis page.

