- Market Overview: Weekend Market Analysis
- 30-year Treasury Bond futures
- EURUSD Forex market
- S&P500 Emini futures
- Monthly Emini chart is in strong bull trend, but this 3rd push up is possible parabolic wedge buy climax
- Parabolic wedge buy climax
- Weekly S&P500 Emini futures chart has sell signal for failed breakout above bull channel
- Daily S&P500 Emini futures chart is stalling at the top of its bull channel
- Forrest Gump would be a good trader
Market Overview: Weekend Market Analysis
The SP500 Emini futures chart is in a strong bull trend, but this week formed a late February sell signal bar on the weekly chart. Traders will continue to buy 1- to 3- day pullbacks until there are consecutive big bear days. They then will wait for a 10% correction before buying again.
Bond futures are accelerating down in a parabolic wedge sell climax. They are testing important support so there could be a bounce soon.
The EURUSD Forex market reversed down from a wedge top on the weekly chart, but the reversal is sideways instead of down. There might be one more push up before the EURUSD corrects down to the November low at 1.16.
30-year Treasury Bond futures
Bond futures weekly chart collapsing down to support
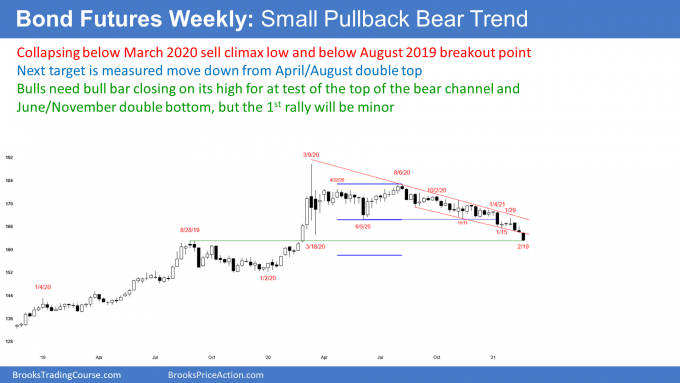
Bond futures have been in a bear trend for a year, and they have been accelerating down on the weekly chart for 2 months. This week, they broke below the March 18 low, which was the bottom of the reversal down from the most extreme buy climax in history. Additionally, they dipped below the support of the August 28, 2019 high. That was the breakout point for last year’s extreme buy climax.
They also broke below the bear channel from the August 28 low. However, most breakouts below bear channels fail within about 5 bars. Therefore, traders should expect several weeks of sideways to up trading to begin before the end of March.
Sell climax near support so bounce soon
In addition to bears taking profits soon, some bulls will buy. They are taking the low probability bet that the yearlong selloff is just a sell vacuum test of the August 2019 high. In a bear trend, a trader will make more money selling than buying. Bonds are going lower, next year, in 5 years, and in 10 years.
I have been saying for several years, that the bond market would probably put in a top that will last for a couple decades, and last year’s buy climax is a good candidate for that top. Also, the yearlong selloff from that high is consistent with the end of the 30-year bull trend.
Are bonds in a bear trend or a trading range?
It is common for a trend to end, and then transition into a trading range instead of reversing into a bear trend. That is what the bulls are hoping is the case here. They want the selloff from the August high, to be a bear leg in what will become a trading range. They then want a bull leg back up to the top of the trading range.
It is important to note that the selloff from the August high has been in a bear channel. I said that most breaks below bear channels fail. Most of the time, there is ultimately a bull breakout. That is why I say that bear channels are bull flags. Traders should expect a break above the bear trend line at some point. However, a break above a strong bear channel usually leads to a trading range and not a bull trend. This bear trend will last many years so every rally, no matter how strong, will be followed by a new low.
How much lower will sell climax go before bears take profits?
What should traders expect over the next couple months? The next target below is the measured move from last year’s April/August double top. The most important target is the January 2020 low, which was the start of the most extreme buy climax in history. The bond market should reach that low because it is in a bear trend after an extreme buy climax. But the current sell climax is extreme. There could be a sharp short covering rally at any time before reaching that support. However, traders will sell rallies because they are confident that bonds will reach that target.
A sell climax at major support usually attracts profit taking. Therefore, bonds could stop going down, and go either sideways or up for many weeks starting by the end of March.
But even if they reverse up for many months, it is still more likely that they are in a bear trend, and that the trend will last for at least 10 years. I have been saying for a year that interest rates will be higher in 5 and 10 years, whether or not the bonds have a yearlong rally before then. Sell bonds.
EURUSD Forex market
EURUSD weekly chart is in tight trading range after wedge top
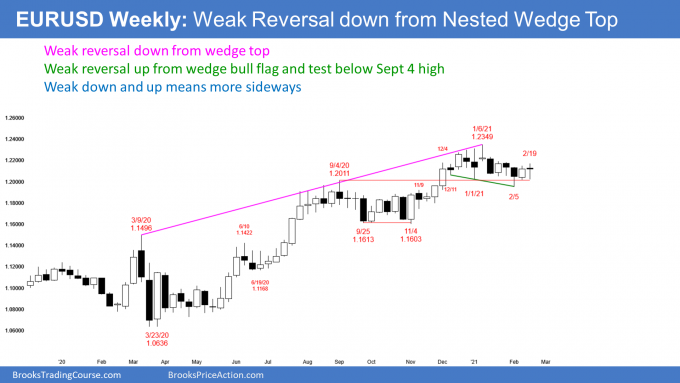
The EURUSD weekly chart has had a weak reversal down from a wedge top in January. Traders are wondering if the 7-week selloff is a bull flag instead of the 1st leg down from a wedge top.
When a market is unclear, it goes sideways. Traders need more information, and they get it from seeing additional bars.
The yearlong bull channel was strong enough so the 7-week selloff will probably not grow into a bear trend. However, a reversal down from a wedge top typically has at least a couple legs, and it usually tests at least down to the bottom of the 3rd leg up.
So where is the confusion? This seems pretty clear. And it is. What is not clear is whether the 2nd leg up to the September high was so strong, that it started the count over again. Instead of a 2nd leg up from the March 2020 low, it could be a new 1st leg up. If it is, then the January high is only the 2nd leg up in a developing wedge, instead of the final leg up in a completed wedge.
If the reversal down had consecutive big bear bars closing on their lows, traders would conclude that January was in fact the top. But that is not what this selloff looks like. Each bar has largely overlapped the prior bar, and only one bar was a big bear bar closing near its low.
What will the EURUSD do next week?
So what is the probability for each possibility? At the moment, there is a 60% chance that January was the 3rd push up. That means this selloff should continue down to the November 4 low at 1.16.
It also means that there is a 40% chance that the 7-week selloff is a bull flag, and that there will be at least one more new high, before there is a 2-legged selloff down to a prior major higher low.
When traders are uncertain, they buy low, sell high, and take quick profits. That is what created the current 11-week trading range. With this week closing at its open, which is neutral, and with it being in the middle of a 3-week tight trading range, it increases the chance that next week will also be sideways. Traders need to see consecutive strong trend bars up or down, before they will conclude that a trend is underway.
S&P500 Emini futures
Monthly Emini chart is in strong bull trend, but this 3rd push up is possible parabolic wedge buy climax
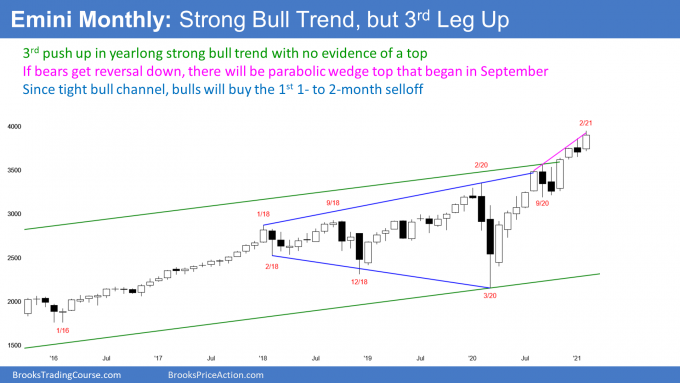
So far, the S&P500 Emini futures market in February is a big bull bar closing about the January high. There is still plenty of time for it to look very different once the month closes next week.
However, it is unlikely that the month will close near its low because that is very far below. At a minimum, the bears want the month to close below the January high. Traders would see that as a sign that the bulls are not as strong as they have been.
Furthermore, the bears would like the month to close in its lower half. Traders would see that as slightly bearish. It would increase the chance of sideways to down trading in March.
Parabolic wedge buy climax
The Emini on the monthly chart has rallied strongly for the past year. There are now 3 pushes up. A reversal down within the next couple months would therefore be from a parabolic wedge top.
However, a parabolic wedge rally with lots of big bull bars typically does not usually immediately reverse down into a bear trend. Traders expect the 1st reversal down to be minor. That means a month or two of sideways to down trading.
But a couple months down on the monthly chart could still fall a long way. Look at the 35% selloff last year in February and March.
Once there is a reversal this time, how far down should traders expect it to go? Probably about 10%. But there is no sign of a top yet on the monthly chart, and therefore the bulls continue to buy.
Weekly S&P500 Emini futures chart has sell signal for failed breakout above bull channel
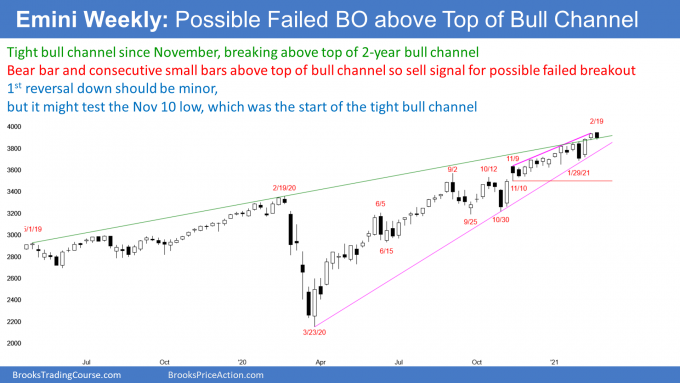
The weekly S&P500 Emini futures chart traded sideways this week, after last week’s breakout above a bull channel that began in May 2019. Most of the time, a breakout above a bull channel fails within about 5 bars. Traders should expect a reversal down at some point before the end of March.
This week closed on its low, and is therefore a sell signal bar for next week. Next week is also the end of the month, and strong rallies often have profit taking at the end of the month. This increases the chance of lower prices next week. Because the buy climax is so extreme, there is a 40% chance of next week forming a big bear bar on the weekly chart.
Also, if a swing down is beginning, traders should start to see bearish things. This includes big bear bars closing on their lows, and consecutive bear bars. This week gapped up, as did several weeks at the end of the year. If next week gaps down on the weekly chart, that would be a significant change in the market’s behavior. If it gaps down and closes on the low of the week, next week would be even more bearish.
But that does not mean a reversal into a bear trend. Strong bull trends often reverse down. For example, this one reversed down about 10% in September and again in October. The bull trend then resumed.
The Emini has been in a tight bull channel since November 10. While that is a buy climax, it is also a sign of strong bulls. They will be eager to buy a 2- to 4-week pullback once they get the chance. That makes it likely that a selloff will become a bull flag, and not a bear trend. But after such a protracted rally, it could last a couple months, like in September and October.
Daily S&P500 Emini futures chart is stalling at the top of its bull channel
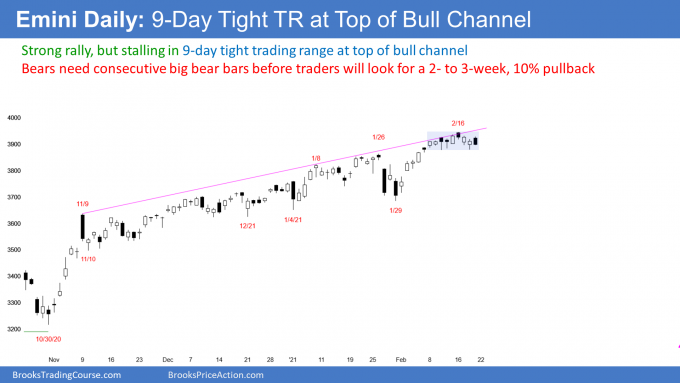
The S&P500 Emini futures daily chart formed a bear bar closing near its low on Friday. It is therefore a sell signal bar, in a buy climax, at the top of a bull channel. However, the bears need a couple consecutive big bear days, before traders will hold onto shorts for more than a day or two.
The Emini has rallied strongly in a tight bull channel since November 10. The bears were able to create many big bear bars, but the bulls bought each one. And they will continue to buy every reversal down, until there are consecutive big bear days closing near their lows.
That is what traders needed to see at the start of the 10% selloffs in September and October. And it is the opposite of what happened at the March 2020 pandemic low. The bulls needed to see a leg up that contained two big bull bars, before concluding that a reversal up was underway. Back then, there was a small bull bar in between the 2 big bull bars.
Everyone knows that the Small Pullback Bull Trend that began with the October low has lasted a long time. Trends don’t last forever so traders are expecting a pullback. But a trend can last much longer than what traders expect.
Forrest Gump would be a good trader
I sometimes talk about the Forrest Gump approach to trading. This is an example. Traders don’t need to think too much. They will continue to buy every reversal down, until there are consecutive big bear bars. Then, they will expect a few weeks down.
How far down? The first targets are always about a 50% retracement of the most recent leg up, and a test of the breakout point. This rally broke above the January 26 high, and it is therefore a breakout point. If the selling continues, then traders will look for a test of the bottom of the most recent leg up. Currently, that is the January 29 low at 3,700.
When a buy climax lasts an extremely long time, like this one has, the selloff often retraces about half of the rally. That would be down to the November 10 low, which was the start of the bull channel. Another guideline is that it has about half as many bars as there were in the rally. Therefore, if there is is going to be a big selloff, it could last a couple months and fall more than 10%.
How likely is that? Right now, traders are buying all selloffs so it is not likely. But if there is a strong reversal down, the bears would have a 40% chance of it being big.
What about a bear trend? When traders talk about a bear trend, they mean a 20% selloff from the high. A strong bull trend does not usually reverse into a bear trend without 1st forming a trading range or a double top. Therefore, there is only a 30% chance that the 1st reversal down would grow into a bear trend on the daily chart.
Trading Room
Traders can see the end of the day bar-by-bar price action report by signing up for free at BrooksPriceAction.com. I talk about the detailed Emini price action real-time throughout the day in the BrooksPriceAction.com trading room. We offer a 2 day free trial.
Charts use Pacific Standard Time
When I mention time, it is USA Pacific Standard Time (the Emini day session opens at 6:30 am PST, and closes at 1:15 pm PST). You can read background information on the intraday market reports on the Market Update page.

