Al added some comments to report
Market Overview: Weekend Market Analysis
The SP500 Emini futures traded below November’s low on the monthly chart following a failed OO (Outside-Outside) pattern. Since the bull trend is strong, this is a minor sell signal with an Emini bear follow through bar. There are several support zones around the current levels, such as the bull trend line and the 50-day and 100-day moving averages on the daily chart. Traders are deciding whether the Emini will test the October low or make a new high.
The EURUSD Forex is trading sideways to up following last week’s bull reversal from below from the bear channels on the weekly and daily charts. The bulls will need strong follow-through buying over the next 1- to 2-weeks to increase the odds of a stronger pullback (bounce). The bears are hoping that the yearlong bear trend will resume down from a double top bear flag. But even if it does, the EURUSD should begin about 2 months of sideways to up trading soon.
EURUSD Forex market
The EURUSD monthly chart
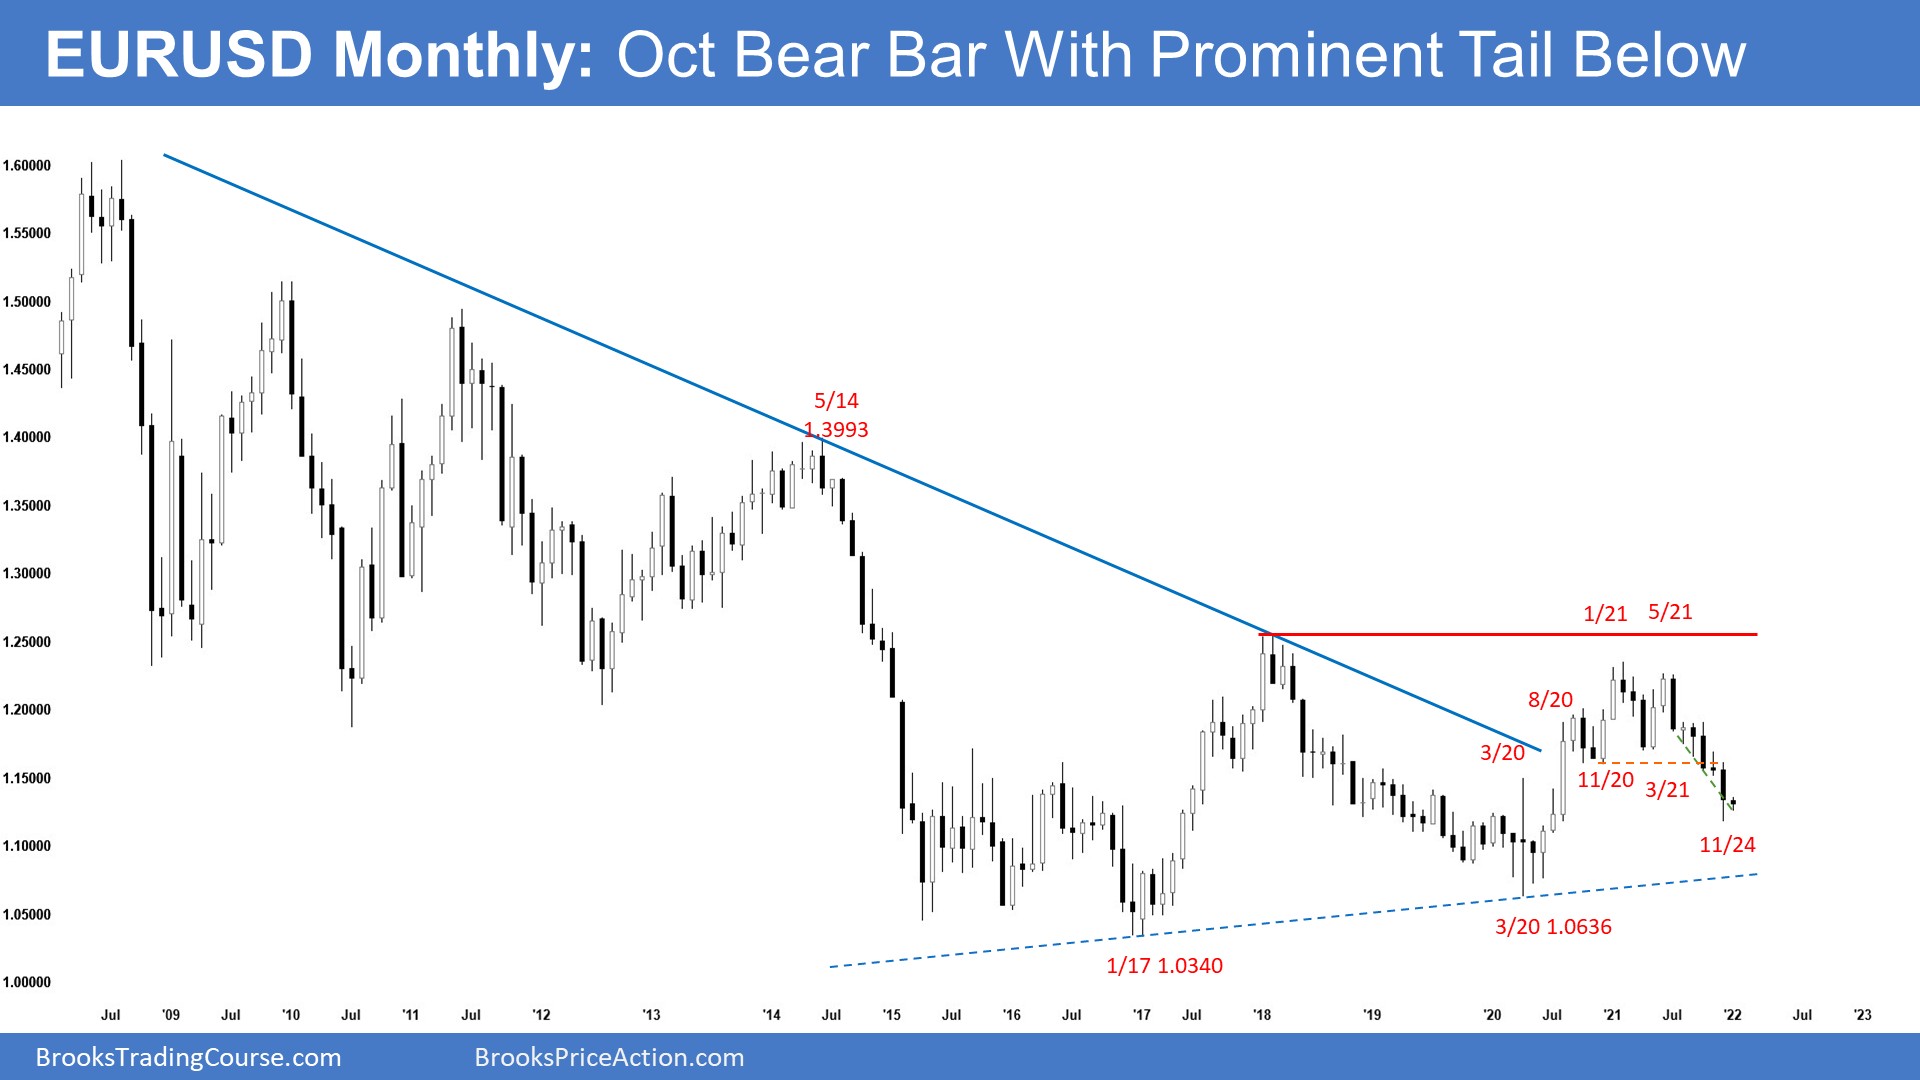
- November’s candlestick was a bear bar with a prominent tail below.
- The weak close indicates that it was not as strong as it could have been.
- The bears want a 700-pip measured move lower based on the height of the yearlong trading range.
- The move down since September is in a tight channel which means persistent selling.
- There are also 3 pushes down since June, which is a wedge. However, the bulls need to create strong bull bars if they are going to stop the selling.
- The bulls want a reversal higher from a trend channel line overshoot after testing below March 2020 high support. They hope that the selloff is simply a pullback from last year’s breakout above the bear trend line.
- Al has been saying that EURUSD is in the middle of a 7-year trading range and the selloff was climactic. That makes it likely to go sideways to up for a couple of months soon, whether it ultimately breaks below last year’s low and the bottom of the 7-year range.
- The bulls need to do more here by creating several bull bars closing near their highs to convince traders that the sell-off from July has ended.
- If there is a reversal up within a few months, the 7-year trading range will be a triangle, beginning with the 2017 low.
The EURUSD weekly chart

- This week’s candlestick on the weekly EURUSD Forex chart was a doji bar. The bulls did not get strong follow-through buying from last week’s bull reversal bar, which was also a doji bar.
- Doji bars in a trend are a sign of balance. They increase the chance of a transition into a trading range soon. There might be another brief leg down before the bear trend transitions into a trading range.
- This week triggered a buy signal for a failed breakout below a bear channel. However, this week’s candlestick was almost a perfect doji. It is not yet a strong reversal up, but the selling has stopped for 2 weeks.
- Al has been saying that the EURUSD has been in a support zone for a few weeks and that it will likely reverse up for at least a few weeks. Most likely, it will soon form a trading range for at least a couple of months, but it might go a little lower first.
- Less likely, the bear trend will continue down in a tight bear channel to below last year’s low.
- The bulls will need strong follow-through buying over the next 1- to 2-weeks. If they get that, it will lead to a 2-legged sideways to up move that typically lasts around 10 or more bars. On the weekly chart, that is at least a couple of months.
- If those legs are strong, there could be a rally back to the October 28 high, which was the start of the most recent sell climax and therefore a magnet.
- If the current pullback is more sideways, it would increase the chance of another leg down. The bears are hoping that this rally will quickly form a bear flag and then resume the yearlong bear trend.
- However, with the chart in a 7-year trading range, traders still expect a couple of months of sideways to up trading to begin soon. Legs rarely go straight from the top to the bottom without some confusion, which is a hallmark of a trading range. This year has been clearly bearish. Clarity does not last forever in trading ranges.
- The 2021 selloff is still more likely a pullback from the 2020 rally than a resumption of the bear trend that began 14 years ago. A couple months of sideways to up trading is likely before there is a breakout below the bottom of the 7-year range, if there is going to be a breakout below the bottom before a breakout above the top.
- There is only a 30% chance that this selloff will continue down with only brief pullbacks and then break strongly below the 7-year trading range.
The EURUSD daily chart
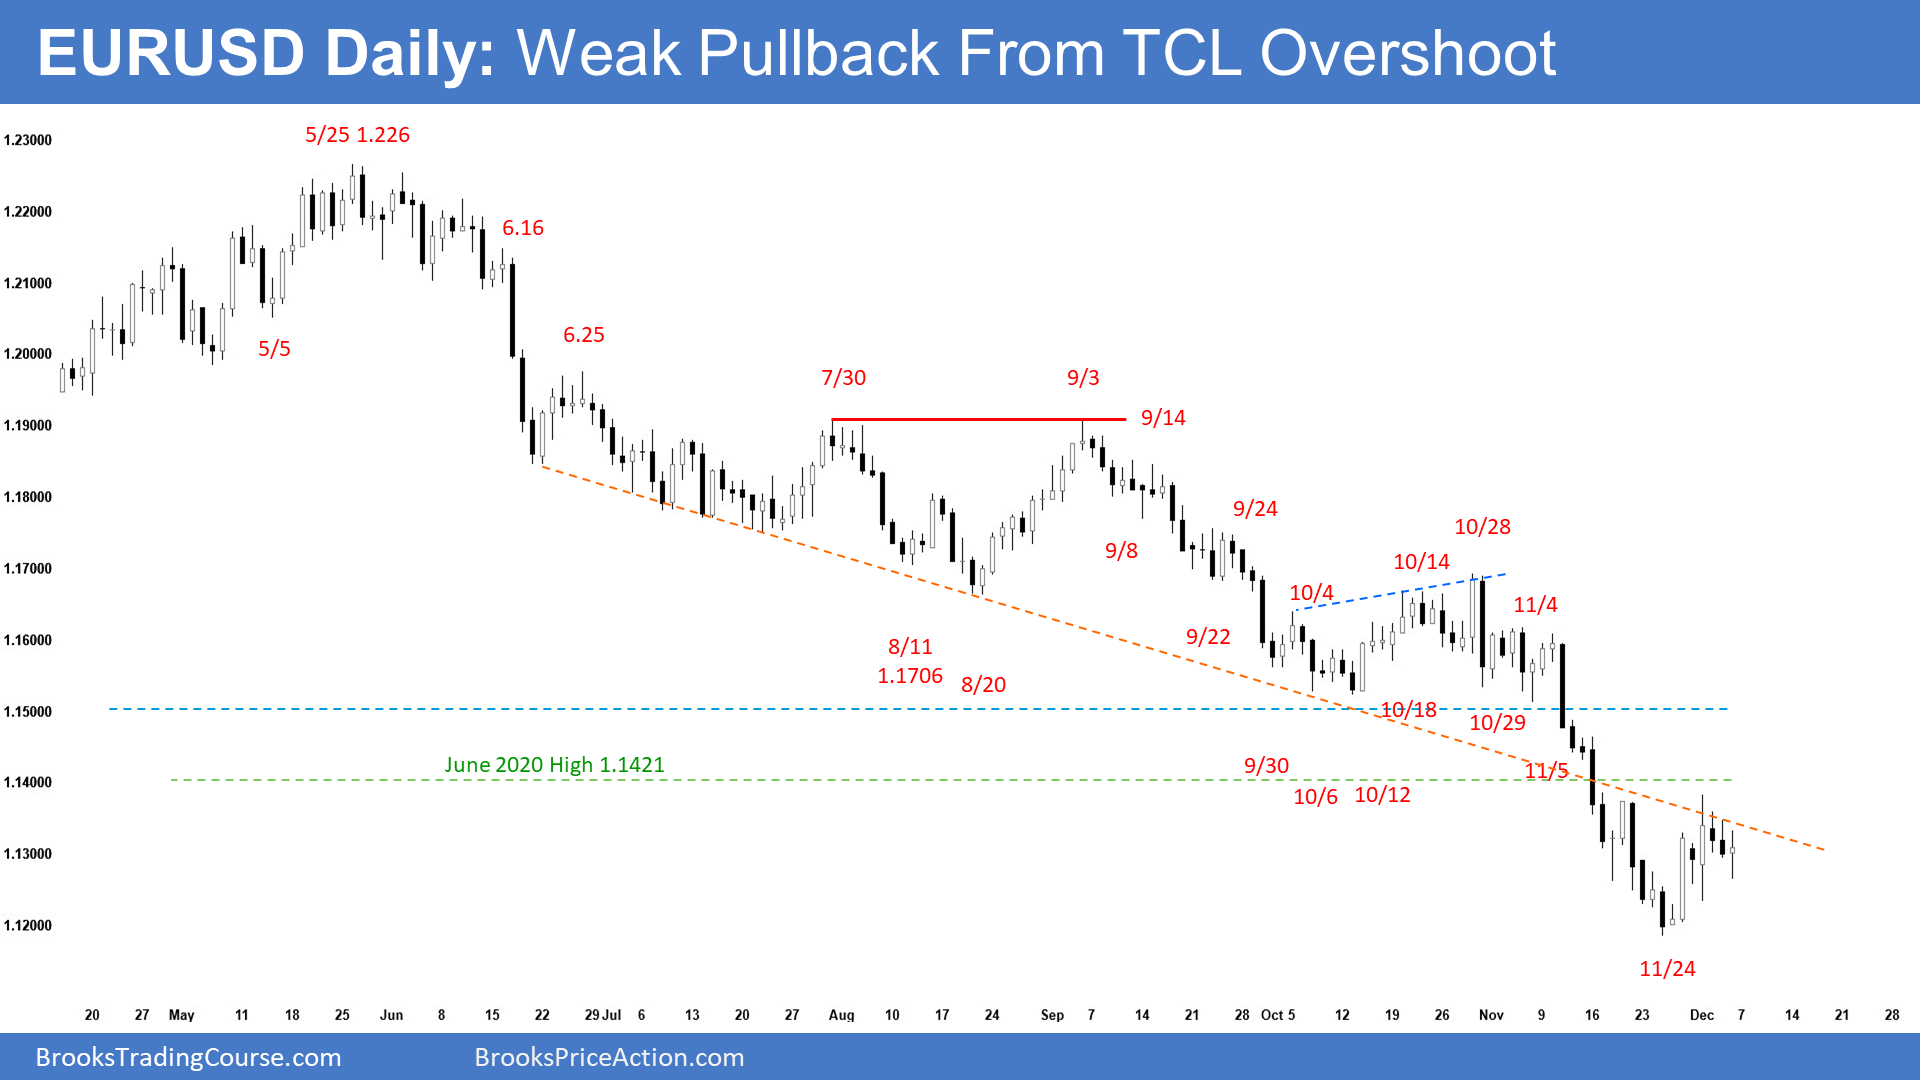
- The EURUSD formed an outside up bar on Tuesday, but it had prominent tails above and below the bar and it stalled at the high from 8 bars earlier.
- Thursday broke below the bear inside bar, and the bears want a strong reversal down from a double top bear flag (November 18 and 30). It was also a Low 2 sell signal.
- However, the bears are not yet getting follow-through selling. Therefore, the bear flag so far is failing.
- The bulls are hoping that the EURUSD is in a Small Pullback Bull Trend after a sell climax in a support zone (see weekly chart above). If there is a breakout above the November 18 and November 30 double top, a measured move up would be back to near the bottom of the yearlong trading range.
- A strong breakout above the double top would likely be the start of a couple of months of sideways to up trading.
- Friday was a bull doji which is a weak buy signal bar for a High 1 in a Small Pullback Bull Trend.
- The bears are hoping that this rally will fail and that the yearlong bear trend will resume.
- If the current reversal is more sideways, there could be a new low.
- However, with the chart in a 7-year trading range, traders still expect a couple of months of sideways to up trading to begin soon, whether or not there is a brief break below the 3-week trading range.
S&P500 Emini futures
The Monthly Emini chart
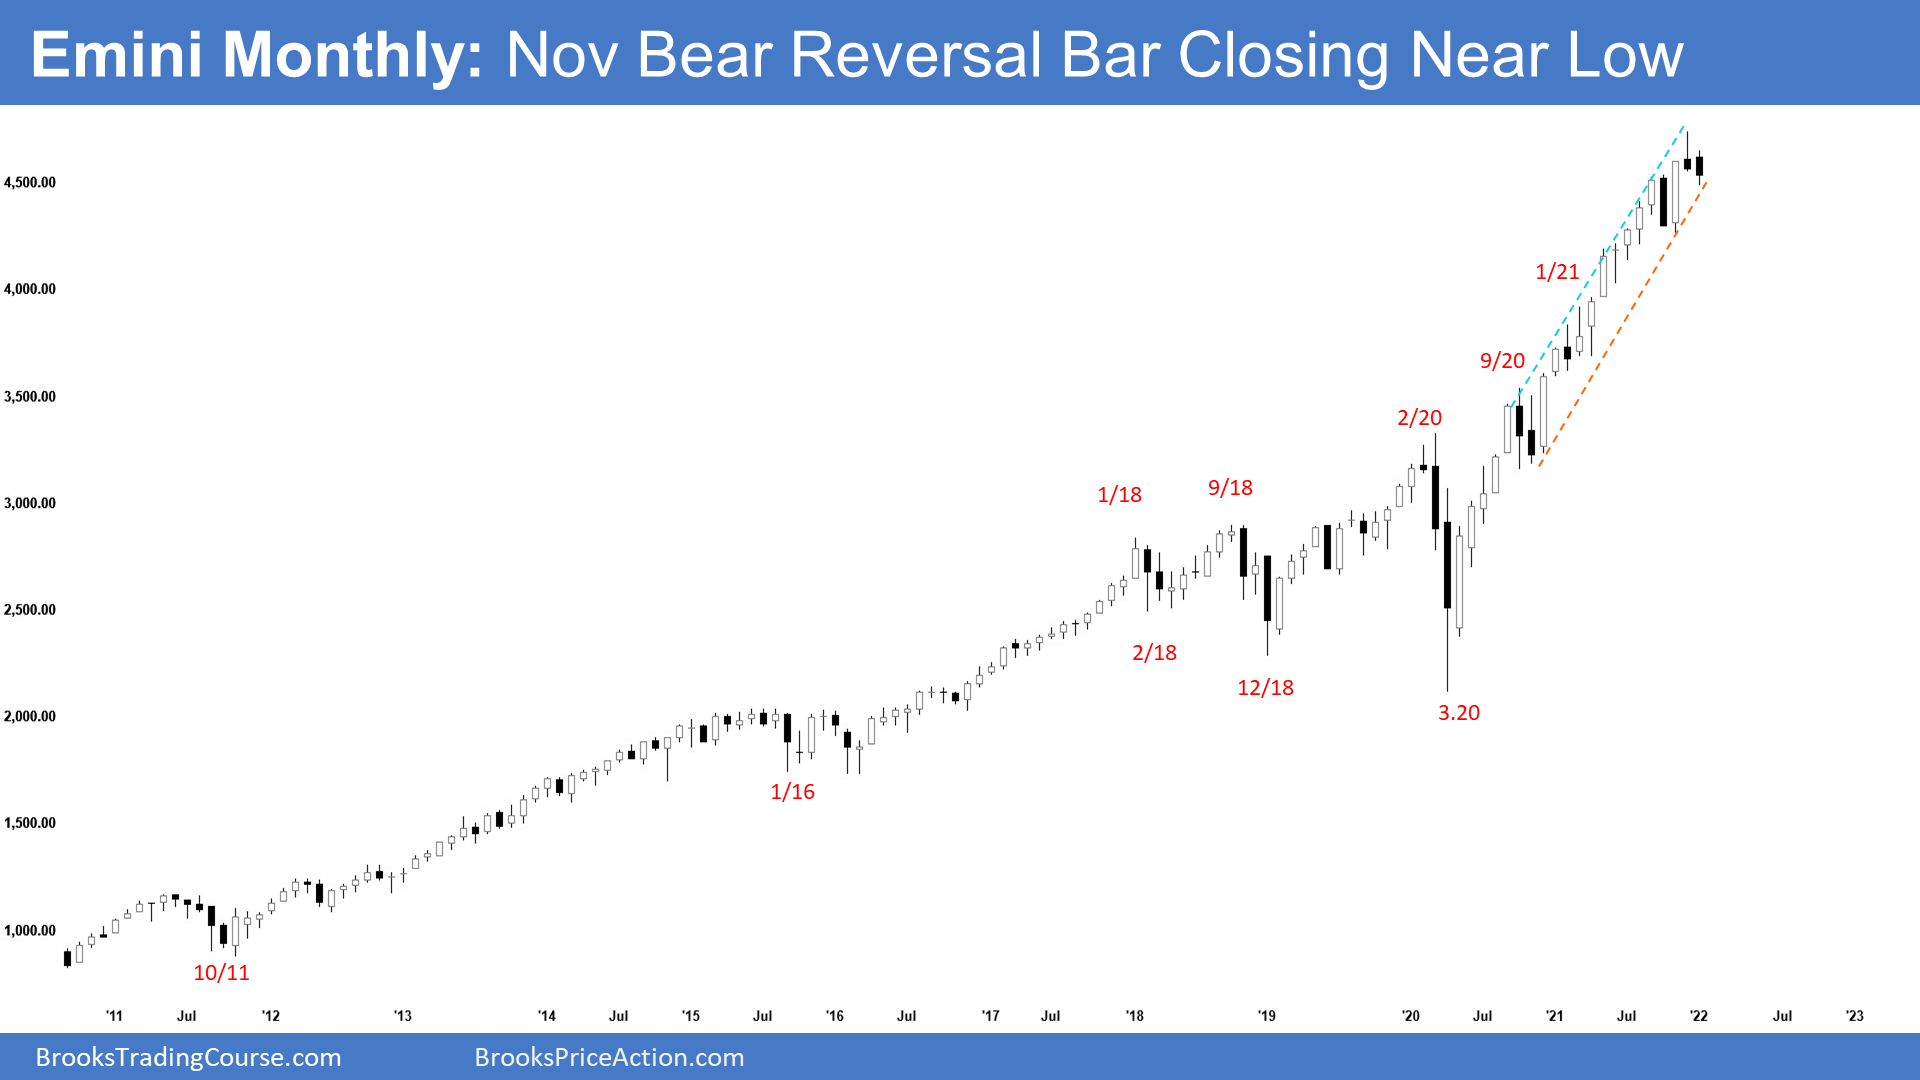
- The November monthly Emini candlestick was a bear bar. It closed near its low with a long tail above, and it also closed below October high.
- It is a sell signal bar for a failed breakout above the Sept-Oct OO (outside-outside) pattern.
- If there is a selloff and it breaks below the OO, that would trigger an OO sell signal.
- But because the bull trend is so strong, it is a minor sell signal. That means the best the bears can probably get is 2 or 3 sideways to down bars to maybe a little below the October low.
- However, when there is a reversal from an extreme buy climax, the market often enters a trading range. For example, the Emini went sideways for 2 years after the January 2018 buy climax.
- The bulls hope that December reverses up to a new high before the end of the year. If it did, it would be an outside up bar, which is bullish.
- However, it would be the 3rd leg up since September, and a third leg up often attracts profit takers. In this case, it would also be a micro wedge.
- Therefore, while the Emini might make a new high in December or early in 2022, it probably will not last long. There is better than a 50% chance of at least a couple months sideways to down trading beginning within the next few months. It might have already begun.
- Al said that when October formed a big bear bar, that there should be a 2nd bear bar within 2 months. Sometimes it comes in the 3rd month. November became that 2nd bear bar.
- The bears see November as a reasonable sell signal bar as it closed near its low. They want a strong reversal down from a failed OO buy signal.
- The bulls want the Emini to resume up in a Small Pullback Bull Trend.
- Al mentioned that the year opened on its low and it is now near its high. On the yearly chart (Al will show the chart in early January), 2021 is a big bull bar that currently has a small tail above.
- Most big bull bars have conspicuous tails on top (in this case, 1 bar on the yearly chart is 1 year). It usually comes from a pullback just before the bar closes. That is why Al said that there was an increased chance of a reversal in December. Bars often change their appearance just before they close, and what happens in December is just before the 2021 bar closes on the yearly chart.
- The computers know this tendency. Bull computers will try to overwhelm the bear computers and get the year to close on its high. That could even lead to a gap up in January, which would create a gap up on the daily, monthly and yearly charts. With the final trading day of 2021 being a Friday, there would also be a gap up on the weekly chart.
- Therefore, there is an increased chance of a big move in either direction in December.
- If the year closes on its high, there will be an increased chance of higher prices early next year.
- But if December is a bear bar closing near its low on the monthly chart, the new year will probably trade down.
- The strong bull trend should soon transition into a trading range for several months and possibly longer.
The Weekly S&P500 Emini futures chart
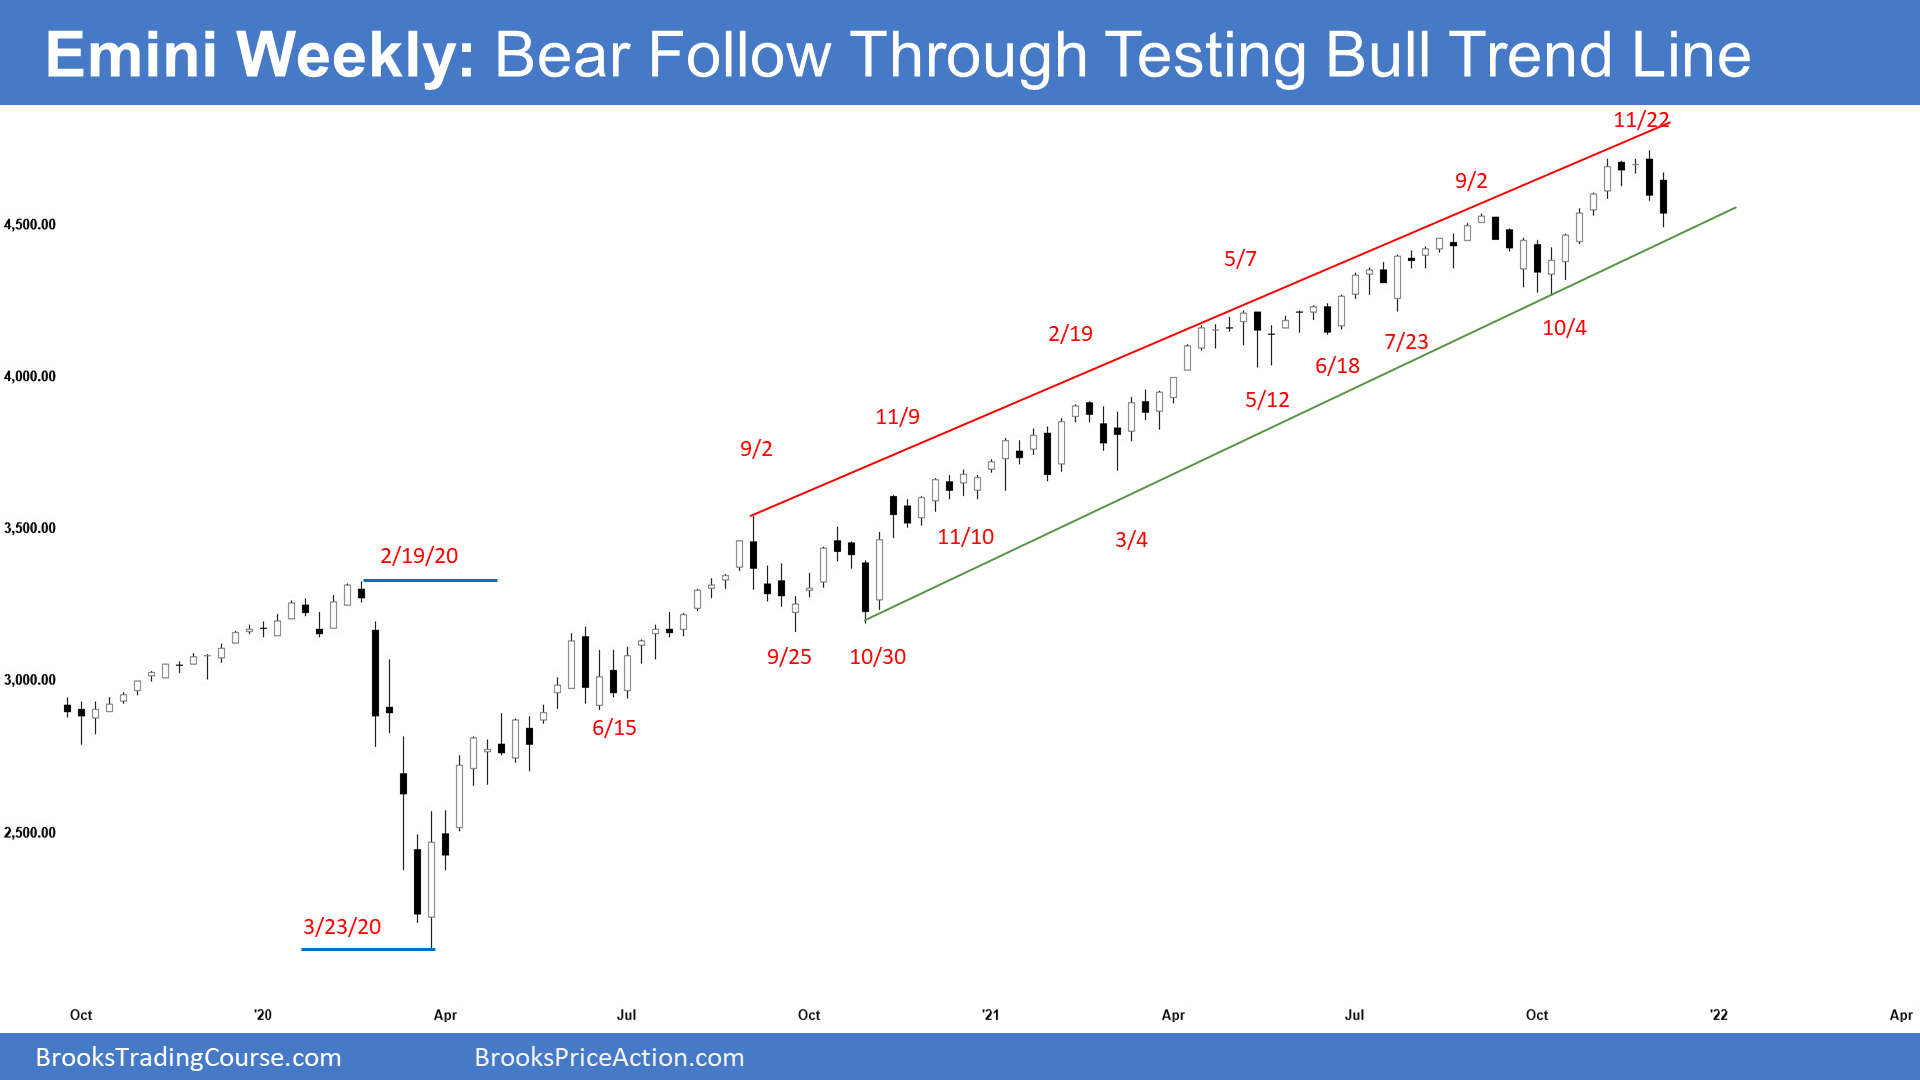
- This week’s Emini weekly candlestick was the 2nd consecutive big bear bar closing near its low. That is a Bear Surprise, which typically will lead to at least slightly lower prices within a few bars.
- The prominent tail below indicates the bears are not as strong as they could have been.
- The bears need to break the bull trend line with a consecutive bear bars closing near their low to convince traders that a correction is underway. Below that bull trend line, the next target for the bears is the Oct low.
- The current sell-off is in a support zone. It is around a 50% pullback, near the bottom of the bull channel, and testing the September 2 high.
- Since it has not quite reached the bear trend line, many traders may not buy aggressively until they believe the support has been adequately tested.
- Is this the start of a correction? The Emini has been in a strong bull trend since the pandemic crash. There have been a few times when the bears got the probability of a correction up to 50%, but never more. If there is follow-through selling next week, this will be another one of those times.
- The probability of higher prices has been between 50 and 60% during this entire bull trend. It has never been below 50%. That continues to be true.
- The strong selloffs like in September in 2020 and again 2021 push the probability for the bears up to 50%. But every prior reversal has failed, and the bears never had better than a 50% chance of a trend reversal.
- If the bulls get a strong reversal up next week, the probability of a new high by the end of the year will be again back to 60%.
- Odds slightly favor sideways to down next week, but a strong reversal back up can come at any moment as the Emini is still in a Small Pullback Trend.
The Daily S&P500 Emini futures chart
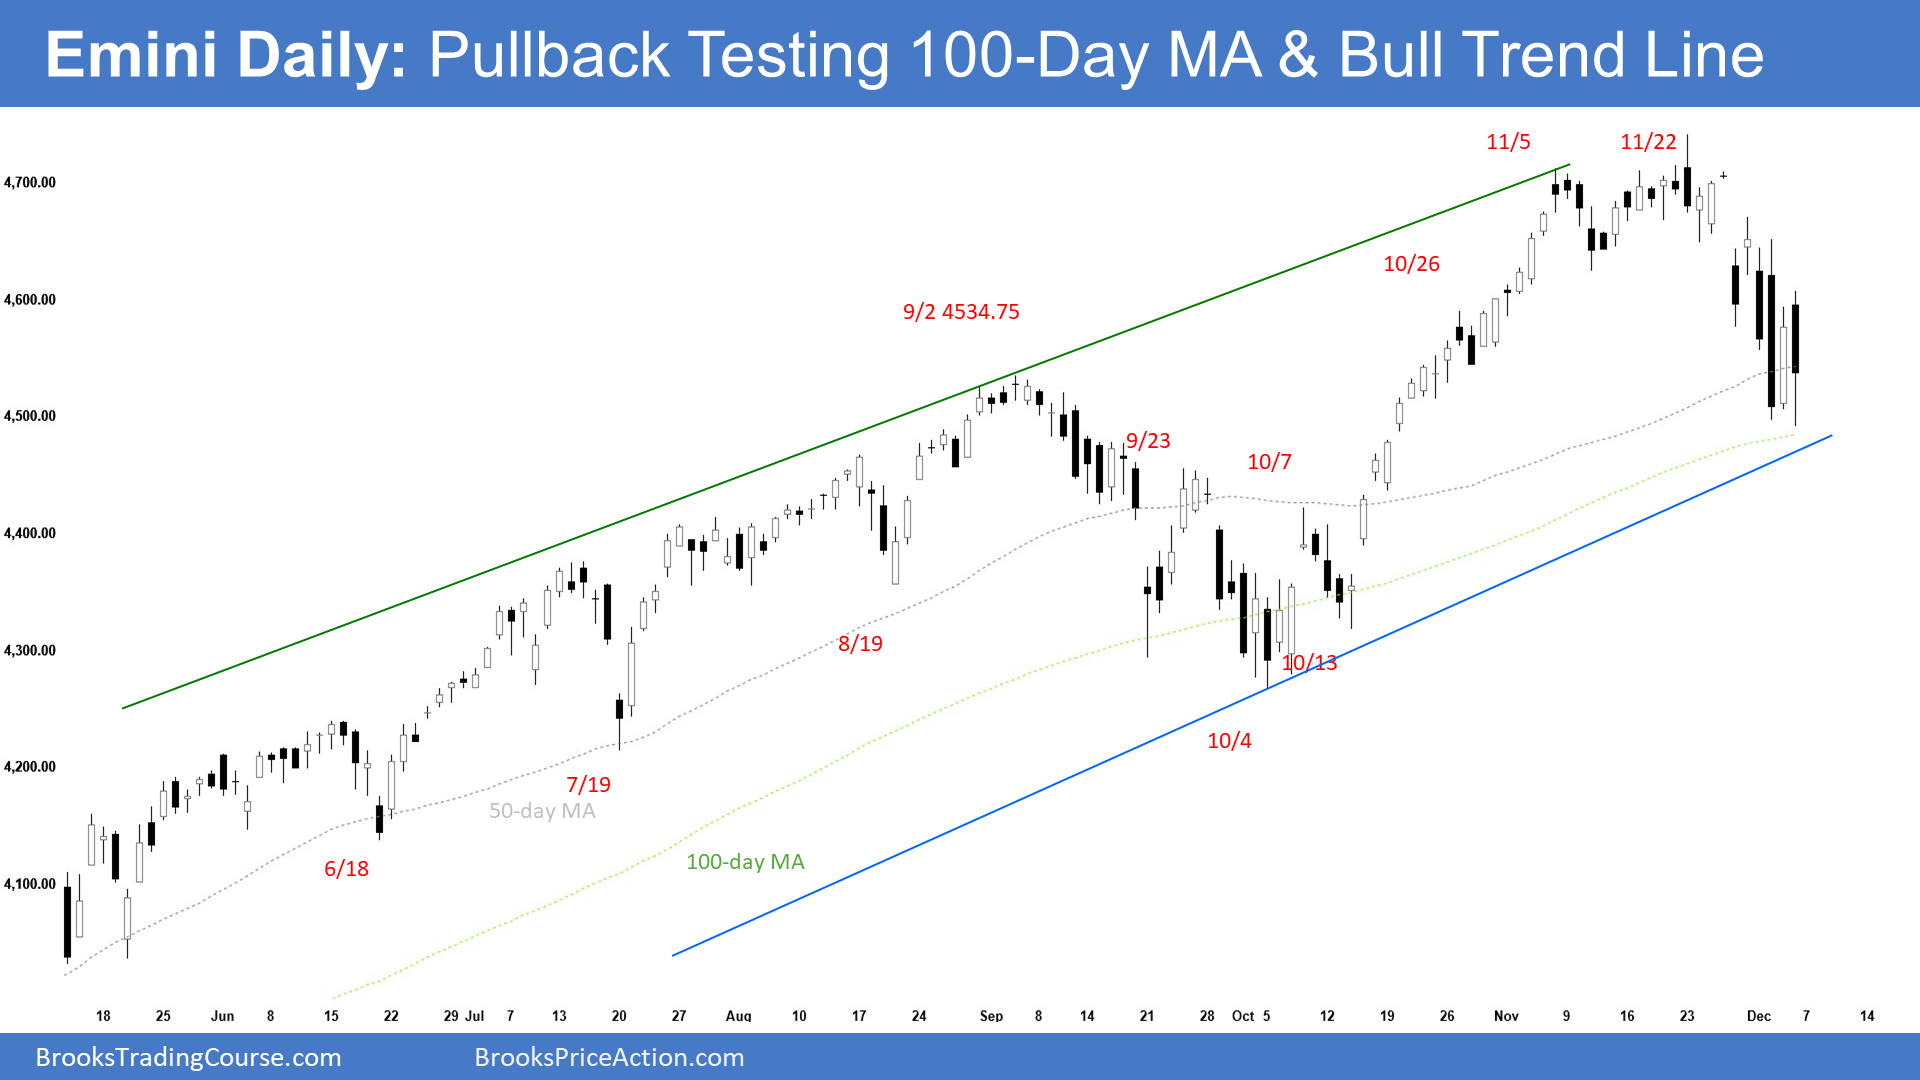
- The current pullback is around a 50% pullback from the Oct rally. It is also around the 50-day and 100-day moving averages and just above the bull trend line which are support zones.
- Finally, it dipped below the September 2 high, which was likely. Al has said several times in November that the Emini would do that because it is a breakout point and there was a buy climax. The October rally could still be part of the trading range that began in July.
- While it is not obvious, this selloff is a micro wedge, which increases the chance of a reversal up. There are 2 ways to look at this as a micro wedge.
- For the 1st interpretation, the 1st push down was on Tuesday. Wednesday opened near Tuesday’s high and sold off again for a 2nd push down. Friday made a new low and it was a 3rd push down.
- The 2nd interpretations is that the micro wedge began 7 days ago. Then, Friday is the breakout below the wedge.
- These repeated failed attempts down are a problem for the bears. They might give up. If they do, the year could still close at a new high.
- However, if the Emini breaks strongly below the micro wedge low (Friday’s low, which was also the week’s low), traders should expect about a measured move down. That is almost exactly at the October low and almost exactly a 10% correction. Both of these targets are magnets.
- The bulls want this selloff to fail. If next week breaks below the micro wedge, traders should understand that breakouts below wedges fail about 50% of the time.
- If there is a strong breakout with strong follow-through selling, the probability of a test of the October low before there is a new high will be 50%.
- We will find out next week. A strong reversal up will probably lead to a test of the all-time high by the end of the year. A strong selloff next will will probably lead to a test of the October low.
- In situations like this, the market often goes sideways for several days before deciding on the direction.
- It has been sideways for 3 days.
- Friday was a big outside day. The day after an outside down often is an inside day. If that happens on Monday, there would be an ioi (inside-outside-inside) pattern, which is Breakout Mode. Monday would be both a buy and sell signal bar.
- It is important to understand that the 1st breakout of a Breakout Mode pattern fails and reverses 50% of the time.
- In any case, next week should give traders an idea of what to expect for the rest of 2021… up, down, or mostly sideways.
- Al has been saying that the Emini might just go sideways before deciding between going up to the high or down to the October low.
- When the chart is not clear, it usually goes sideways. It could be sideways for a few days or a month or two.
- At the moment, the chart is not clear. The Emini has been reversing every day or two.
- Consecutive big bull bars would swing the odds back in the bull’s favor, while consecutive big bear bars would increase the bear’s odds of a deeper pullback.
- Traders will be monitoring whether the bears can break below the confluence of support at around the 4500 Big Round Number.
Trading Room
Traders can see the end of the day bar-by-bar price action report by signing up for free at BrooksPriceAction.com. I talk about the detailed Emini price action real-time throughout the day in the BrooksPriceAction.com trading room. We offer a 2 day free trial.
Weekly Reports Archive
You can access all weekly reports on the Market Analysis page.

