Market Overview: Weekend Market Analysis
The SP500 Emini futures market is at the top of a 2-month trading range. A bull breakout is slightly more likely. The bears want a reversal down from a double top.
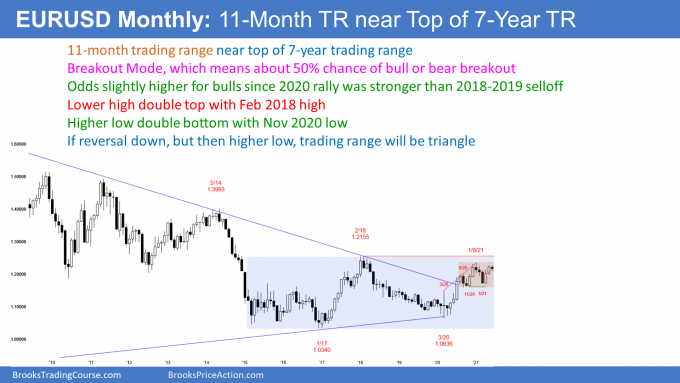
The EURUSD Forex is near the top of an 11-month trading range nested within a 7-year trading range. The odds slightly favor an eventual bull breakout. In the meantime, traders are looking for reversals every few days.
EURUSD Forex market
The EURUSD monthly chart

- 11-month trading range at top of 7-year trading range. Most attempts to break out of a trading range fail, adding more bars to the trading range.
- Trading ranges always have both reasonable buy and sell signals.
- They frequently contain both a double top and a double bottom. The pattern often evolves into a triangle before there is a breakout.
- June so far is bear inside bar. Bears are hoping it is the start of a selloff to the bottom of the 7-year range. More likely, it is not (see below).
11-month trading range
- Higher low double bottom (November 2020 and March 2021) and lower high double top (January and May, 2021).
- Bears want strong break below March low, which is neckline of January 2021/May 2021 double top.
- They then want measured move down from below the November 2020 low (bottom of 10-month range) to bottom of 7-year trading range
- Bears also want 2nd leg down from last year’s wedge top.
- Bulls want any selloff in June or July to be a pullback from the April/May strong rally.
- Bulls want the the November 2020/March 2021 double bottom to lead to a break above the February 2018 top of the trading range.
- The April/May rally was strong enough, so that the June selloff is more likely a pullback from that rally, than the start of a bear trend.
- Therefore, a selloff in June and July will probably stay above the March low, and the 10-month trading will have evolved into a triangle.
7-year trading range
- Higher low double bottom (January 2017 and March 2020), and a lower high double top (February 2018 and January 2021).
- If there is a big reversal down from here, it will probably not break below the 2017 bottom of the 7-year range, because last year’s rally was strong, and it came from a higher low.
- Furthermore, any selloff will probably turn up from above the March 2020 higher low.
- Therefore, if there is a big selloff from here, the trading range will more likely evolve into a triangle.
S&P500 Emini futures
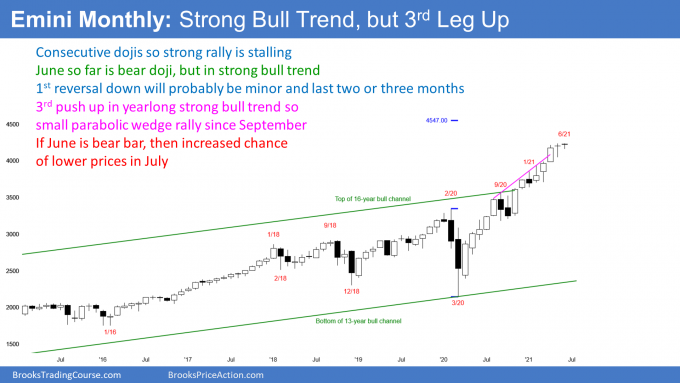
The Monthly Emini chart

- Strong rally from last year’s pandemic low, but rally has had 3 pushes up. It is therefore a parabolic wedge, which often attracts profit takers.
- Buy climaxes can last much longer than what seems reasonable.
- Parabolic wedge does not guarantee profit taking. The Small Pullback Bull Trend could continue for many more months, without a 2- to 3-month pullback, but that is unlikely.
- So far, June is a small bear inside bar.
- If it remains a bear bar, many traders will see that as a sign of profit taking in a parabolic wedge buy climax. That would increase the chance of lower prices for at least a couple months.
- Bulls want June to be a 5th consecutive bull bar. That would be unusual this late in a buy climax.
- Therefore, June will probably close below the open of the month, even if June goes above the May high before the end of the month.
- Because the bull trend is so strong, if the Emini sells off for a few months, the reversal will probably be minor.
- A minor reversal only has a 30% chance of growing into a bear trend (major reversal) without first transitioning into at least a small trading range.
- While the 1st pullback will probably be only a few months, it is important to note that it could lead to a trading range that could last a year or more. The January 2018 buy climax led to a trading range that lasted 2 years. The trading range that began in 2014 lasted more than a year, despite a very strong bull trend.
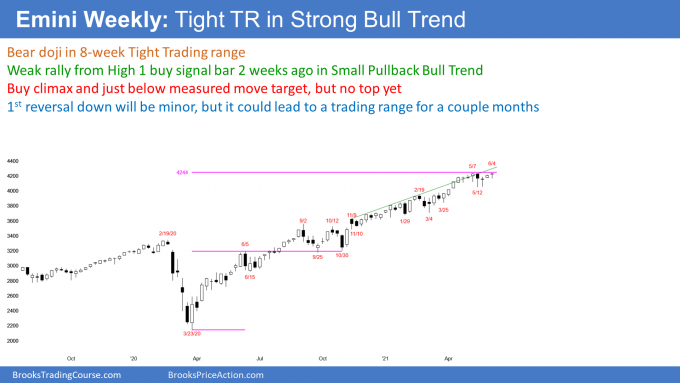
The Weekly S&P500 Emini futures chart

- Outside down week that reversed up, and ended as outside up week.
- Closed above last week’s high, but not above May 7 all-time high.
- Since closed just below all-time high, might gap up to new high next week.
- Bears want reversal down from small double top with May 7 high. Since strong bull trend, minor reversal is more likely than bear trend. A minor reversal is usually only a few weeks, like all of the other minor reversals since the March 2020 low.
- Small Pullback Bull Trend since March 2020.
- A Small Pullback Bull Trend typically evolves into a trading range once it has lasted 60 bars or so. Therefore, a trading range is likely soon.
- Weekly chart has been in a trading range for 8 weeks, but that is probably not enough to end the Small Pullback Bull Trend. Odds continue to favor higher prices.
- When a strong trend ends, it usually will have a correction that is deeper, and lasts longer than all of the prior corrections in the trend.
- This trend had a 10% correction that lasted 2 months (last September and October).
- Once there is a correction, it should be more than 10%, and last more than 2 months.
- If there is more than a 10% correction, traders begin to look for a 20% correction. This is because Institutions say that a correction has converted into a bear trend once it reaches 20%. Traders see it as a psychological support level, and therefore a magnet.
- Any reversal can be major (become a bear trend). The 1st reversal down in a Small Pullback Bull Trend only has 30% chance of growing into a bear trend without first evolving into a trading range.
- Therefore, even if there is a 20% correction that lasts several months, traders will expect a test of the high, before there would be a 40% chance of a bear trend.
- Until there is a clear, strong reversal down, the odds are that every selloff will just be another small pullback that will lead to a new high.
- A correction (10% or more) is typically not clearly underway until it is about half over.
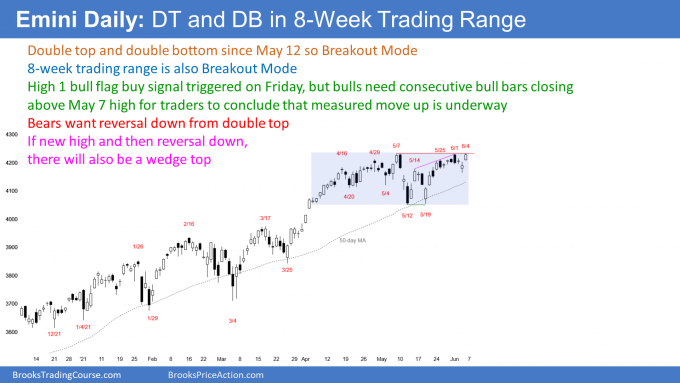
The Daily S&P500 Emini futures chart

- Friday triggered High 1 bull flag buy signal.
- Friday closed near its high, so might gap up to new all-time high next week.
- Even though trading range for 2 months, traders continue to expect higher prices. There is currently 60% chance of bull breakout, and 40% chance of bear breakout.
- Bears want reversal down from around May all-time high. Emini has stalled just above 4,200 for 2 months. It is therefore important resistance in an overbought market.
- If there is new high next week, and then a reversal down, there will be a wedge rally to a higher high double top. The 1st 2 legs of the wedge are the May 14 and June 1 highs.
- Wedge rally to a double top is a common topping pattern.
- Stock market tends to rally around June 26 through the 6th of July. That means it tends to not rally in mid-June, which increases the chance of sideways to down for a couple weeks.
- Most tops fail. Traders will continue to buy every reversal down until one is exceptionally strong. They will then conclude that the market is correcting.
- A correction is usually half over by the time traders decide it is underway.
- Once traders believe the market is in a correction, they like to wait for a 2nd leg down before buying again. That process could take several weeks and possible a few months. It can begin at any time.
Trading Room
Traders can see the end of the day bar-by-bar price action report by signing up for free at BrooksPriceAction.com. I talk about the detailed Emini price action real-time throughout the day in the BrooksPriceAction.com trading room. We offer a 2 day free trial.
Charts use Pacific Time
When I mention time, it is USA Pacific Time (the Emini day session opens at 6:30 am PT, and closes at 1:15 pm PT). You can read background information on the intraday market reports on the Market Update page.

