Market Overview: Crude Oil Futures
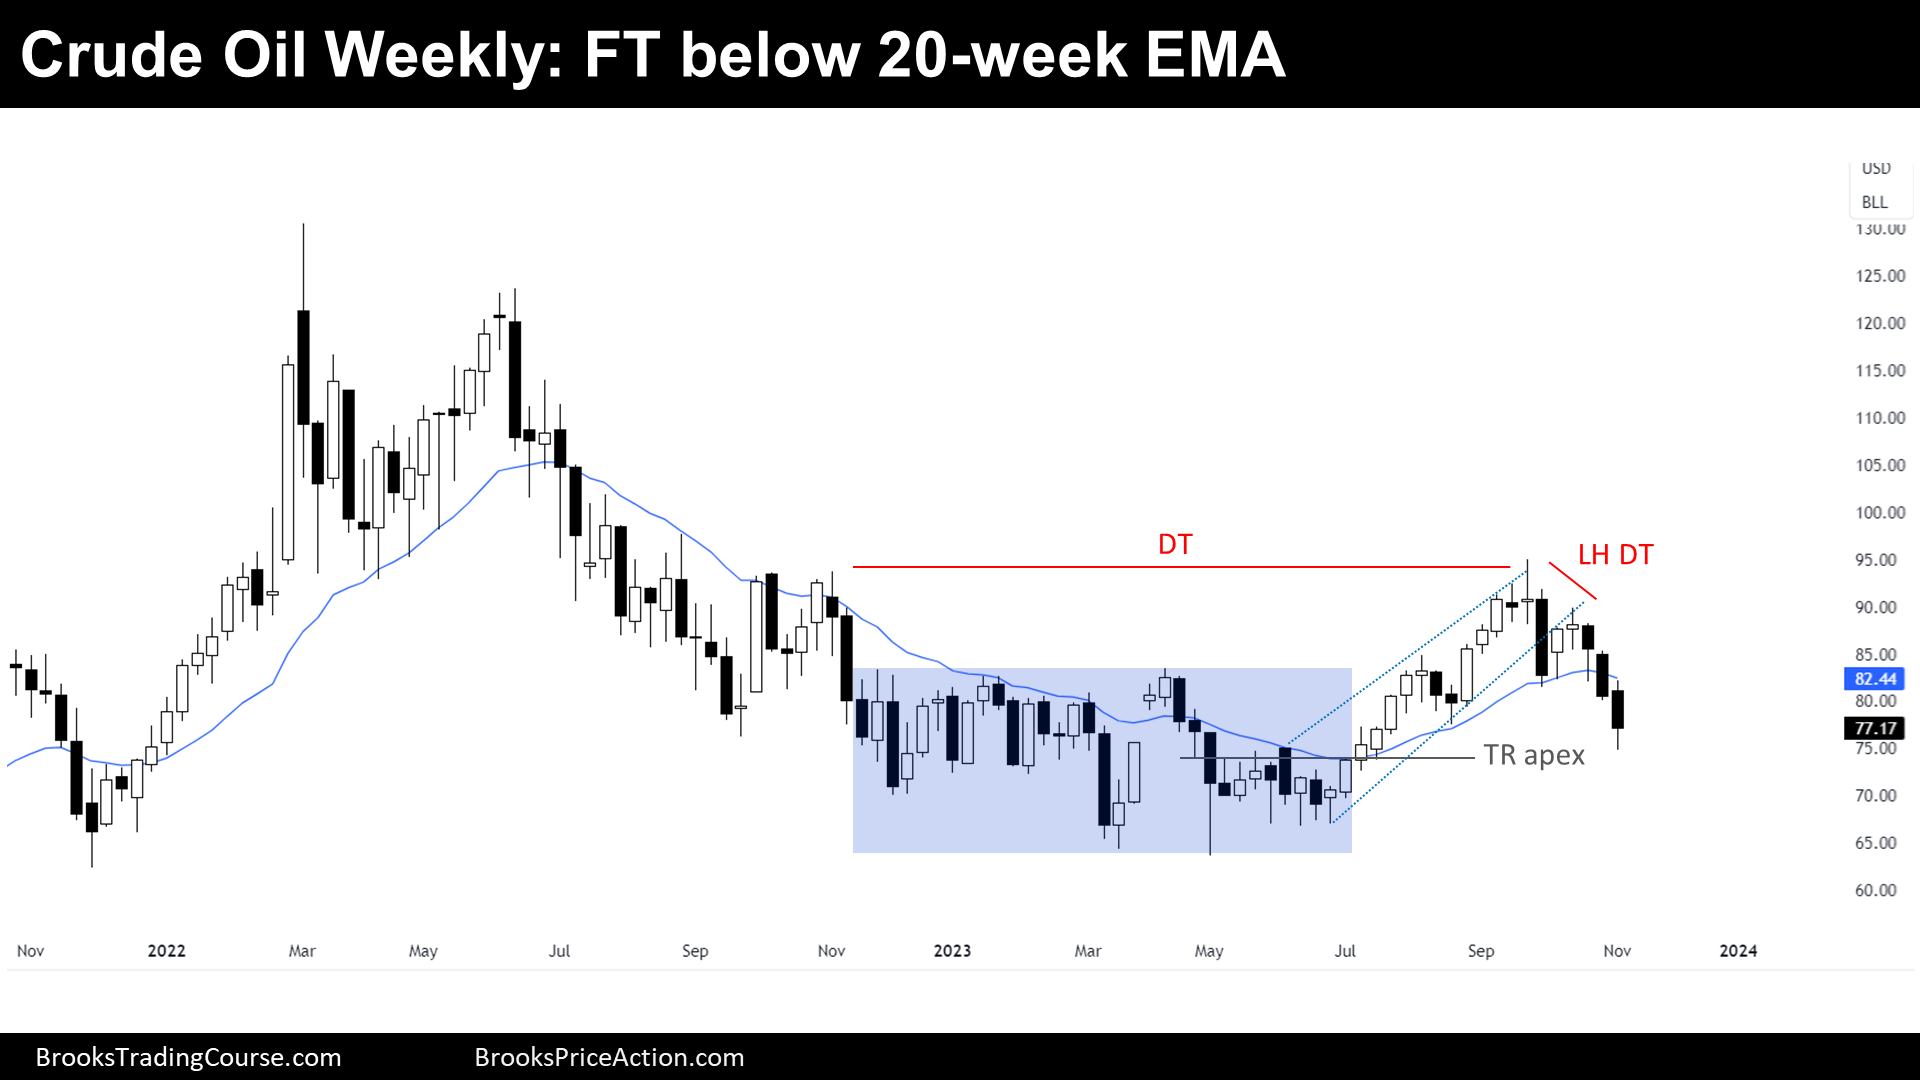
Crude oil futures. The weekly chart formed a two-legged pullback, this week it is a Follow Through bar closing below the 20-week EMA after last week’s bear signal bar, and it’s also the 3rd consecutive bear bar. The bears created follow-through selling below the 20-week EMA which increases the odds of trading lower.
Crude oil futures
The Weekly crude oil chart

- This week’s candlestick on the weekly Crude Oil chart was a bear bar closing near its low and it is the second consecutive bear bar below the 20-week EMA.
- Last week, we said that if this week bears creates a follow-through bear bar, that would increase the odds of lower prices. This is what happened.
- The bears managed to get follow-through selling and a larger second leg sideways to down.
- They think that this is a reversal from a larger double top bear flag (Nov 17, 2022, and Sept 28) and a lower high major trend reversal (Oct 23).
- They hope that the strong move up (from Jun to Sept) was simply a buy vacuum and a bull leg within a larger trading range.
- Previously, the bulls had a tight bull channel from June to September.
- They see the current move as a two-legged pullback.
- They wanted the 20-week EMA to act as support, but now it is resistance.
- They hoped to get a measured move based on the height of the 41-week trading range, instead, it is testing the apex, which is a little lower.
- Since this week’s candlestick is a bear bar closing below its midpoint, odds slightly favor the market to trade at least a little lower.
- Traders will see if the bears can keep trading down or if the bulls will be able to get a reversal, closing back above the 20-week EMA.
- Bears got a couple of strong consecutive bear bars and there is a magnet below, so traders expect sideways to down trading to follow.
The Daily crude oil chart

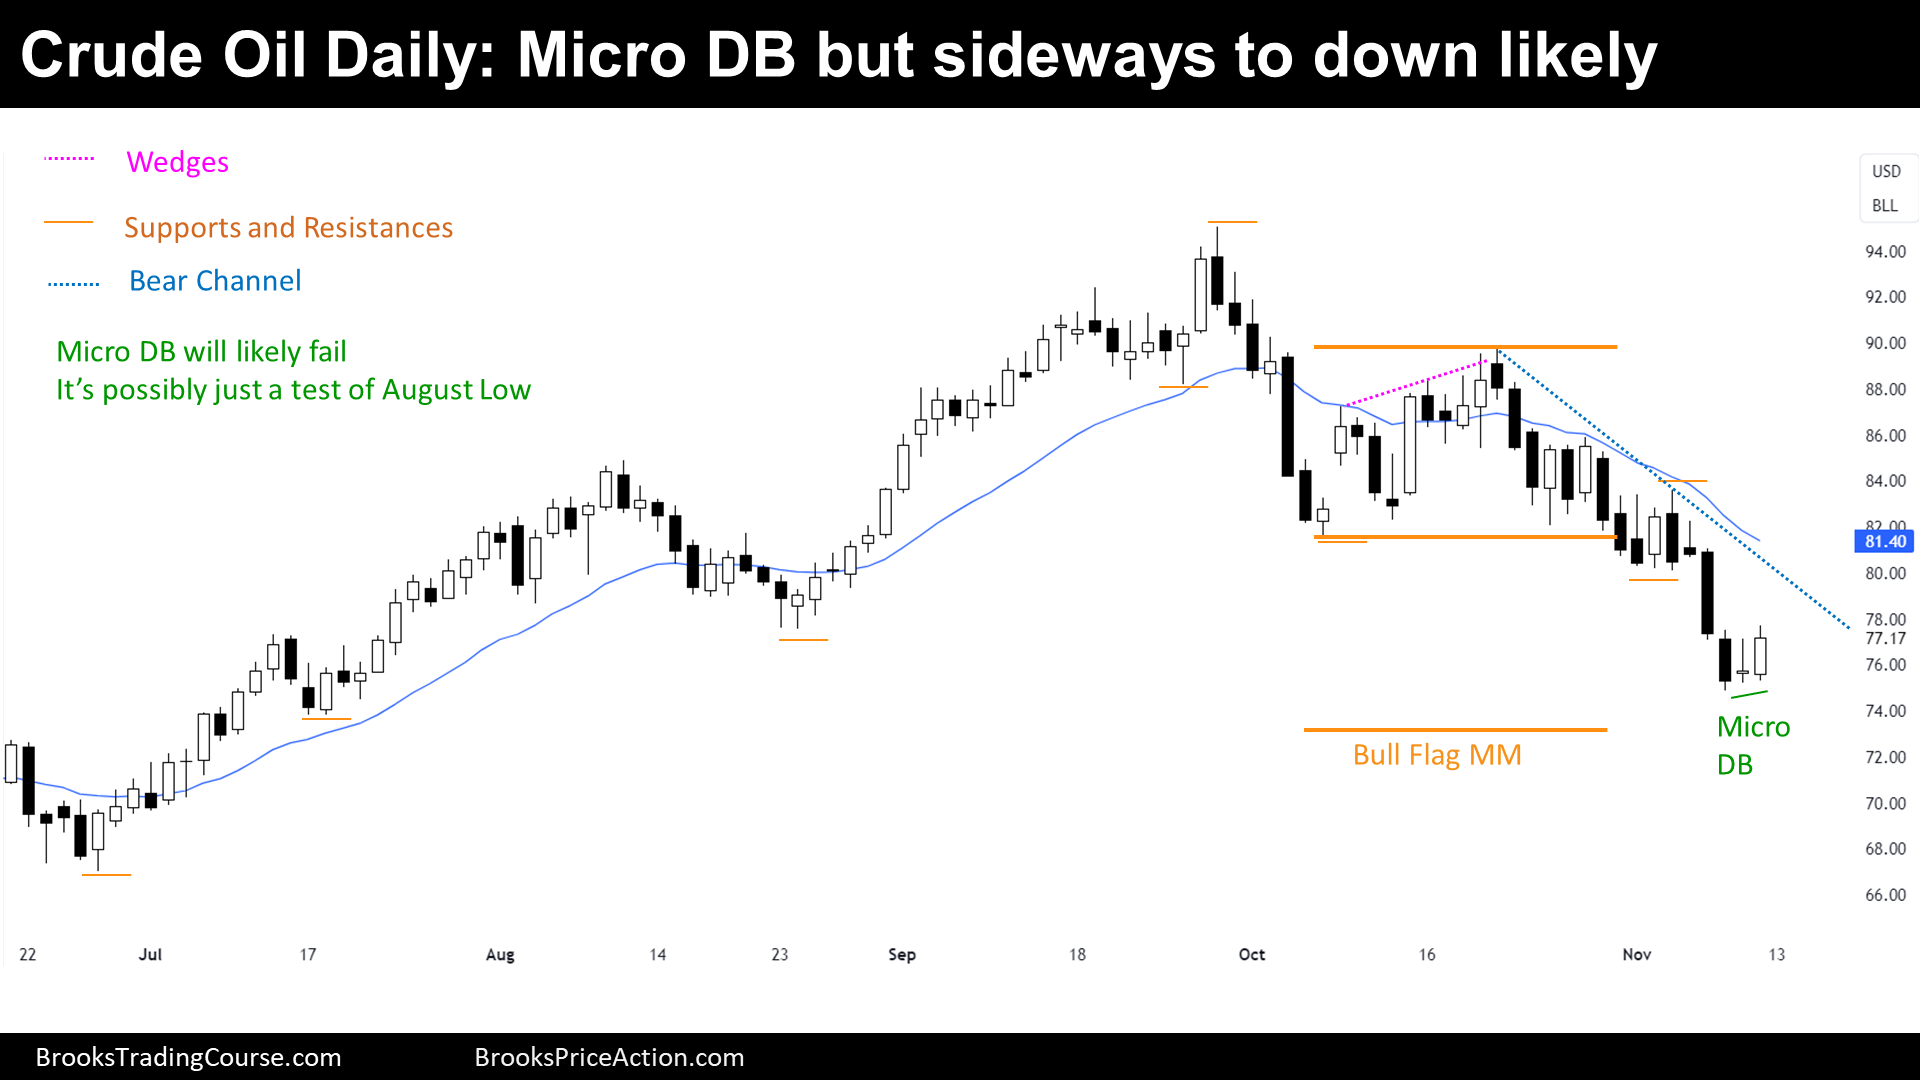
- During the week, the price did a couple of strong bear breakout bars.
- But then, on Thursday, the price did a bear inside bar which was also a High 1.
- A bad High 1 buy since it was following a strong bear breakout and also the High 1 was a doji closing around its low.
- Friday was a bull bar with a good bull body that comes after a micro double bottom;
- However, the price is likely just testing the August low and it is viewed as a Low 1 sell setup.
- Bears want to get to the measured move based upon the size of the Bear Flag.
- Furthermore, the measured move it is around the apex of the weekly trading range apex and thus, it is a magnet.
- Bulls would like to get consecutive bull bars, and get back above the 20-day EMA.
- More likely, the best that bulls can get is sideways trading during the following weeks.
- Odds favor a test down to the Bear Flag’s Measured Move.
Market analysis reports archive
You can access all the weekend reports on the Market Analysis page.

