Monthly S&P500 Emini futures candlestick chart:
Buy climax
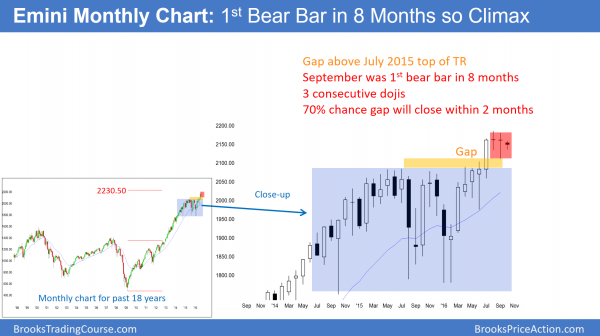
The monthly S&P500 Emini futures candlestick chart is forming its 3rd consecutive doji bar. While this is a small bull flag, it is a weak buy setup and there are probably sellers above.
The monthly S&P500 Emini futures candlestick chart had 7 consecutive bull trend bars prior to September. Every time that has happened in the 18 year history of the Emini, the Emini sold off about 100 points within a month or two. Hence, the probability of a big bull breakout from here is small.
Furthermore, last month’s low created a gap above the 2 year trading range. Since this gap formed after about 100 bars in a bull trend, it is more likely an exhaustion gap than a measuring gap. Therefore, the odds are that the Emini will drop back below the July 2015 high of 2084.50 before going much above the all-time high. Because the bull trend has been so strong, the odds are that the 1st reversal down will attract buyers. As a result, the bulls will likely get their new high.
In conclusion, the odds favor a new high and a pullback below 2084.50. Yet, traders do not know which will come first. Whichever one does will create a high probability setup for a test of the other.
Weekly S&P500 Emini futures candlestick chart:
Both a potential wedge top and an exhaustion gap.
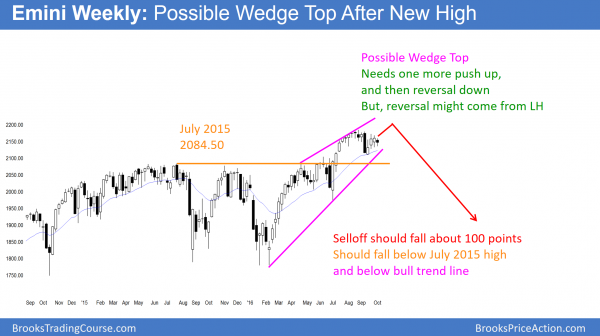
The weekly S&P500 Emini futures candlestick chart has an ii pattern. It is deciding between rallying to a new high and selling off to close the gap above the July 2015 high. It will probably do both, yet no one knows which will come first.
The weekly S&P500 Emini futures candlestick chart has had strong momentum up since the July low. Yet, the August pullback created a gap above the 2 year trading range high. When a breakout late in a trend creates a gap, there is a 70% chance that the gap will close, and only a 30% chance that it will lead to a measured move up. Therefore, the Emini is more likely to fall below 2084.50 before reaching the 2400 measured move target.
Because there was a strong bear breakout in early September, the weak rally since then is a bear flag. Yet, once a bear flag grows to 20 bars, the odds of a bear breakout drop to the same as for a bull breakout. That is the current Breakout Mode situation.
As much as this is true, the bulls might get one more new high before the gap closes. If there is a new high and a reversal down, that would be a wedge top since the February low. The odds would then favor about a 10 bar, 2 legged correction on the Emini chart. The target would be the 1st pullback on the daily chart after the strong reversal up. This is the July 6 low of 2059.25. As a result of that test, the monthly chart would have its correction of about 100 points.
Daily S&P500 Emini futures candlestick chart:
Brief October selloff then new all-time high
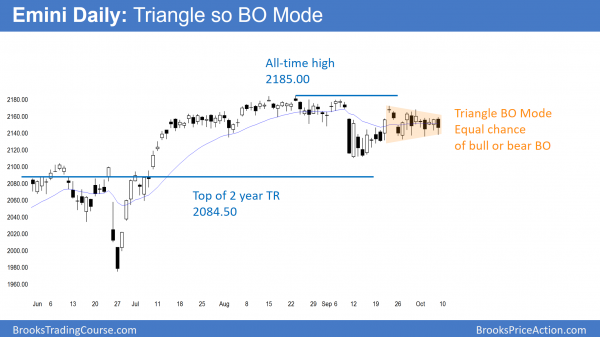
The daily S&P500 Emini futures candlestick chart has been in a triangle for 3 weeks and is therefore in Breakout Mode.
The daily S&P500 Emini futures candlestick chart has a small double top in the August tight trading range. This lead to a brief strong selloff in September, and a month-long weak rally. Hence the bear flag of the last month has an equal probability of bull breakout and a bear breakout. Traders expect that if there is an October selloff, it will probably be brief and then lead to a new all-time high.
October selloff
October often sells off into the middle of the month and then rallies to the end of the year. That can still happen this year because the monthly chart has a buy climax that will probably correct down about 100 points at any point in October or November. Because the odds are that bulls will buy the pullback and create a rally to a new all-time high, bears should be careful selling too low in the breakout. The odds are there will be more buyers than sellers 100 points down from the high.
Traders can see the end of the day bar-by-bar price action report by signing up for free at BrooksPriceAction.com. I talk about the detailed Emini price action real-time throughout the day in the BrooksPriceAction.com trading room. We offer a 2 day free trial.
When I mention time, it is USA Pacific Standard Time (the Emini day session opens at 6:30 am PST, and closes at 1:15 pm PST). You can read background information on the intraday market reports on the Intraday Market Update page.


