Emini weekly bull flag candlestick pattern
Posted 7:01 a.m.
Like most days in the 2 month trading range, today had a limit order, trading range open. Both bulls and bears made money with limit orders in the first 5 bars. This reduces the chances of a strong trend day today up or down.
Yesterday was a sell signal bar on the daily chart, yet it was a doji bar and the 6th consecutive doji. The odds are that there will be more buyers below its low than sellers. The sell signal triggered a few minutes ago, but the Emini paused instead of breaking strongly to the downside.
While the Emini is at support at yesterday’s low and the daily and 60 minute moving averages, it needs a strong reversal up before bulls will conclude that this is an early low of the day. The Emini is Always In Short, yet the bears have been unable to create consecutive big bear trend bars or break strongly below support. Traders are therefore scalping while they wait for a strong breakout up or down. The odds are that today will again have a lot of trading range price action. It therefore will probably have a swing up and a swing down.
Pre-Open Market Analysis
Today is rollover day so remember to adjust your targets and the lines on your charts. Because the volume is still greater on the September contract, I usually don’t start trading December until tomorrow.
The Emini formed a double top yesterday with the August 26 high. That day had a strong rally and then a strong selloff to below a 3 week trading range. It was therefore a major lower high. Because the Emini has also had lower lows since then, it is in an early broad bear channel. Hence, the bulls want to break this double top. Consequently, the bears might give up and the 60 minute chart would then be in a trading range and a bull trend.
Because yesterday turned down and formed a double top, but then turned back up, the odds favored a bull breakout above the double top. As a result, it would then probably test the all-time high. However, the overnight session rallied above the August 26 high and sold off below yesterday’s low. It therefore formed an outside down day, even though the day session has yet to open.
Possible bear breakout below wedge bull flag
Especially relevant is the bear case because the Emini is testing major resistance. If the Emini falls below the September 1 low, it would be a breakout below a small breakout of a small breakout. I know that this is confusing. September 1 was the 3rd push down in a broad bear channel on the 60 minute chart. Hence, the reversal up was from a wedge bull flag. If the bears break below, then they would have a 60% chance of a swing down, possibly to a measured move.
In conclusion, while the bulls are still in control and have a slightly greater chance of one more new high before the selloff, there is still a 60% chance of a 100 point selloff back in September or October back into the 2 year trading range.
Forex: Best trading strategies
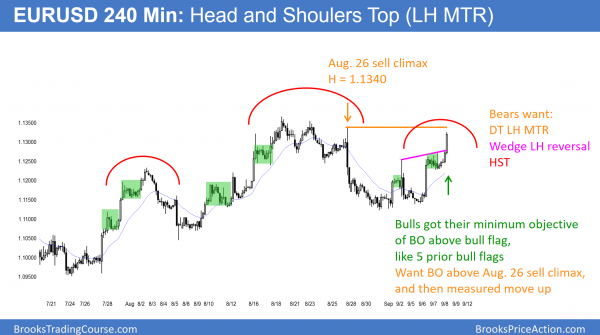
The bulls overnight achieved their objective of at least at least a brief breakout above the bull flag on the 240 minute chart. They therefore want to break above the next target. If they can get above the August 26 sell climax high, they will look for a measured move up.
The bears want the 9 day rally to be a wedge top. They want the EURUSD market to turn down below the August 26 high, which would create a Head and Shoulders Top, or at that high, which would be a Double Top Lower High Major Trend Reversal.
On the 240 minute chart overnight, the bulls got their breakout above the bull flag. The overnight rally has been strong. Hence, the bulls will next try to break strongly above the August 26 sell climax high. That is therefore a key price. They then want a breakout above the 1.1360 top of the trading range. Since most breakouts fail, the odds area against a strong rally from here.
The bears still want a double top bear flag with the August 26 high. That double top is also the right shoulder of a head and shoulders top. It is therefore also a lower high major trend reversal.
The 5 minute chart has an Expanding Triangle Top
The 5 minute chart has formed an Expanding Triangle Top over the past 3 hours. The bears want a reversal down, but the bulls want it to be a bull flag. They therefore want a measured move up to above the August 26 high. Since the EURUSD is so close to that high, the odds are that it will get closer today or tomorrow, whether or not it pulls back first.
Summary of today’s S&P Emini futures price action and what to expect tomorrow
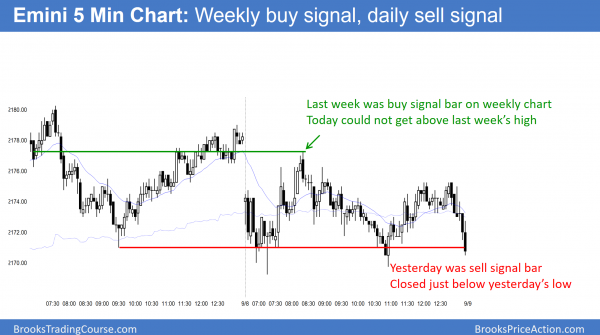
The Emini sold off on the open to below yesterday’s low. After a wedge bottom, it rallied to a wedge top. It sold off again to a wedge bottom and higher low major trend reversal. The rally was weak, as were the other swings, and today closed just below yesterday’s low.
The Emini today formed the 7th consecutive doji bar on the daily chart. While yesterday was a sell signal bar on the daily chart, last week was a buy signal bar on the weekly chart. When the Emini is in a tight trading range, it always constantly forms both buy and sell setups. Yet, it is a limit order market. More money is betting that the setups will fail.
The odds still favor a selloff below the top of the 2 year trading range. However, the odds also slightly favor one more brief new high first. Until there is a strong breakout up or down, most days will be trading range days, and many day traders will mostly scalp.
See the weekly update for a discussion of the price action on the weekly candlestick chart and for what to expect going into next week.
Traders can see the end of the day bar-by-bar price action report by signing up for free at BrooksPriceAction.com. I talk about the detailed S&P Emini futures price action real-time throughout the day in the BrooksPriceAction.com trading room. We offer a 2 day free trial.
When I mention time, it is USA Pacific Standard Time (the Emini day session opens at 6:30 am PST, and closes at 1:15 pm PST). You can read background information on the intraday market reports on the Intraday Market Update page.


