Premarket price action analysis
For tomorrow’s analysis, wait until after today’s close. Then, look at the bottom of this post for “Outlook for tomorrow’s Emini price action and day trading.”
If you want to see today’s premarket analysis, I posted it after yesterday’s close in yesterday’s blog at S&P500 Emini intraday market update.
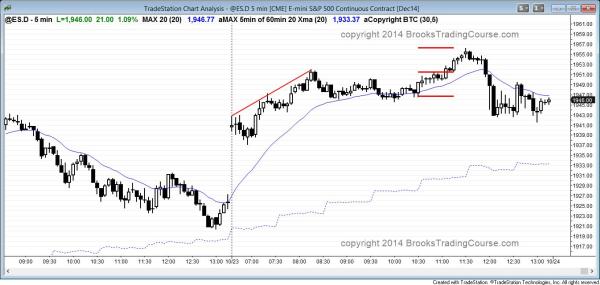
S&P500 Emini intraday market update for price action day traders: gap up and then a bull trend on the open
Posted 7:15 a.m.
The Emini began with a gap up and then a bull trend on the open. Although the market pulled back slightly from its gap up to just below yesterday’s high, it then resumed up and broke out above that high. However, most of the price action was trading range price action. Many bars had prominent tails and the follow-through bar after the breakout also had a big tail. This increases the chances that this is a bull leg in what might become a trading range. The market is currently always in long and traders will buy for any reason. However, because of the hesitation and weak follow-through, traders will look for a reversal, which could create an early high of the day. There could be a parabolic wedge top soon. Unless there is a reversal or a strong bear breakout, the rally will likely continue.
The Emini gapped up after yesterday’s expanding triangle bottom. The 5 and 60 minute charts became very overbought over the past few days and the stock market might have to go sideways for a day or two before trying again to reach the targets above, which are still the October 6 and 8 highs.
The October 6 and 8 highs are the lower highs that the stock market failed to exceed a couple of weeks ago and were the neckline of the October 2 and 8 double bottom. Instead of breaking above the neckline and rallying for a measured move up, the stock market fell below the double bottom and had a parabolic sell climax. The stock market is back above the double bottom and it is trying again to get above that neckline. Since the stock market is in a year long trading range, the rally should be disappointing. One common type of disappointment when there are two highs near one another is for the Emini to rally above one, but then reverse before getting above the other. Traders will look for a reversal above the October 8 high of 1964. That is probably too far for the market to get there today.
As always, if there is a strong breakout with follow-through in either direction, traders will look for a swing trade. The will enter on the close of the breakout bar or on the close of the next bar or on a pullback, especially into the middle third of the breakout.
Outlook for tomorrow’s Emini price action and day trading

The Emini gapped up and pulled back for a few bars and then broke out above yesterday’s high. The bull trend resumed after a trading range, but there was a strong trend reversal down late in the day.
The Emini trended up for most of the day, but sold off late. This created a reversal bar on the daily chart, but that bar has a bull body. Also, the daily chart is in a tight channel. This reduces the chances of a big bear trend day tomorrow. However, because today ended up as a neutral day, it has little predictive value for tomorrow.
Since tomorrow is a Friday, traders will pay attention to weekly support and resistance. The weekly moving average is about 10 points below the close.
At the moment, this week’s candle is reversing the bear candle of two weeks ago. The high of that bar at 1971 is also the October 6 high, which was a double top with October 8. These prices are the most important ones on the chart over the next few days and are magnets. There was a huge bear breakout below that double top, and this means that the market cares about that price area.
If the bulls can get above the October 6 high, they will have completely erased the bear trend that ended last week. The market would then be in a trading range. However, the size of the current bull reversal is enough for most traders to already believe that the daily chart has entered a trading range.
See the weekly update for a discussion of the weekly chart.
Traders can see the end of the day bar-by-bar price action report by signing up for free at BrooksPriceAction.com. I talk about the detailed Emini price action real-time throughout the day in the BrooksPriceAction.com trading room, and a 2 day free trial is available.
When I mention time, it is USA Pacific Standard Time (the Emini day session opens at 6:30 am PST, and closes at 1:15 pm PST). You can read background information on the intraday market reports on the Intraday Market Update page.

