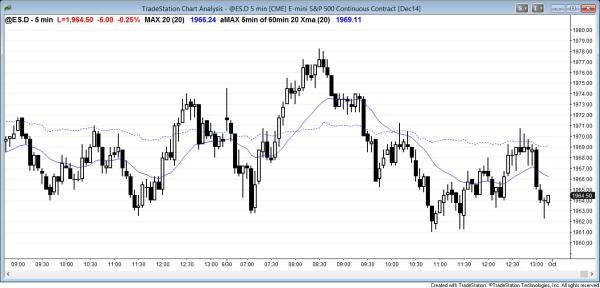
Although the Emini had big legs up and down, it was a big trading range day.
End of day comments about today’s Emini price action and day trading
The Emini reversed sharply up from a test of yesterday’s low, but the 9 point sell off made a bull trend day unlikely. After making a new high of the day, it reversed down 17 points from the high of the day. This made a bull trend day unlikely. Since neither bull nor bear trends were likely, the day was a trading range day. It sold off at the end of the day because today is the last day of the month and the bears wanted a stronger sell signal bar on the monthly chart. They achieved it with the late selloff.
Today is the last day of the month and the monthly candle is a bear reversal bar, but it has a conspicuous tail below. Even though this is a second entry short on the monthly chart (July was the first sell signal bar), it is a weak sell signal bar in a strong bull trend. As I have been discussing in the weekly updates, I think that a few months of a sideways to down pullback is more likely than a bear trend on the monthly chart. However, a monthly bull flag that becomes 100 – 200 points deep could create a bear trend on the 60 minute and daily charts. There should be buyers at the monthly moving average, which at the the moment is below 1800.
S&P500 Emini intraday market update for price action day traders: trading range open for day traders
Posted 7:36 a.m. PST.
There was a trading range open for day traders. The Emini reversed down from above yesterday’s high and tested the bottom of yesterday’s trading range. It then reversed up sharply to the middle of the range and the 60 minute moving average. It is always in long at the moment.
Until there is a strong breakout with follow-through, day traders will trade the Emini like a trading range. They will buy low, sell high, and scalp. The bulls are still hoping for trend resumption up from yesterday’s early rally. The bears want that rally to reverse down. Since there is a wedge bull flag on the 60 minute chart and the monthly chart is so overbought, the bears want a bear breakout below that wedge bottom and then a measured move down. The bulls want a test of the 1992 area, which is the top of the September 24 rally into the close, right before the huge bear trend down on September 25.
Before the open comments on S&P500 Emini 60 minute, daily, weekly, and monthly candle charts
The Emini reversed up from a 60 minute wedge bull flag yesterday, but it is still in a bear channel, forming lower lows and highs.
See the weekly update for a discussion of the weekly chart.
Traders can see the end of the day bar-by-bar price action report by signing up for free at BrooksPriceAction.com. I talk about the detailed Emini price action real-time throughout the day in the BrooksPriceAction.com trading room, and a 2 day free trial is available.
When I mention time, it is USA Pacific Standard Time (the Emini day session opens at 6:30 am PST, and closes at 1:15 pm PST). You can read background information on the intraday market reports on the Intraday Market Update page.

