Market Overview: Nifty 50 Futures
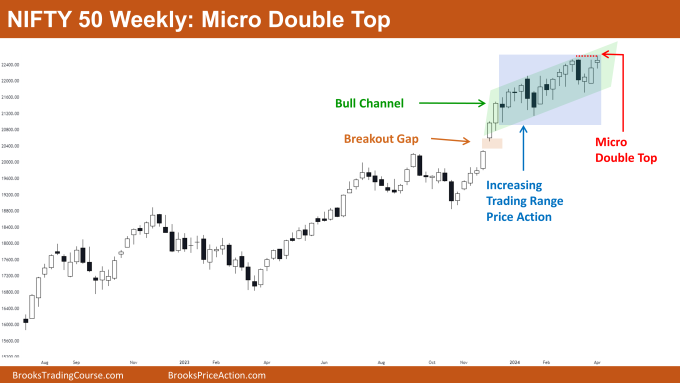
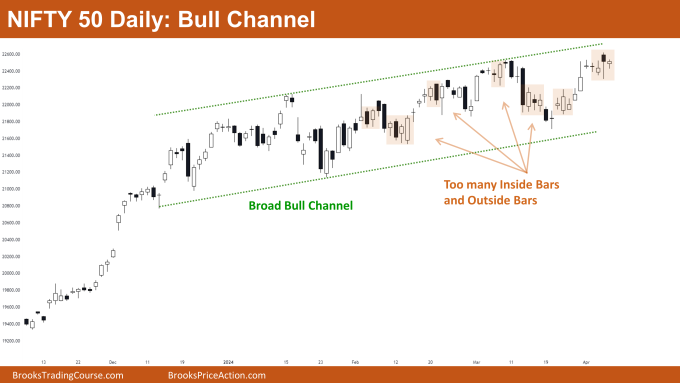
Nifty 50 Micro Double Top on the weekly chart. This week, the market formed a Micro Double Top, followed by a weak small bull doji bar. Currently, it’s trading within a bull channel, albeit a weak one. The price action within this channel resembles trading range behavior, indicating that traders are treating it as such. Until there’s a strong bull breakout from this trading range, it’s advisable for traders to approach it cautiously. On the daily chart, Nifty 50 also exhibits significant trading range price action, characterized by the formation of inside and outside bars, along with numerous bars with tails at both ends.
Nifty 50 futures
The Weekly Nifty 50 chart

- General Discussion
- The market is currently displaying a lot of trading range price action, trading near the plausible trading range. Hence, buyers should refrain from buying at this level.
- Bears can take a short position if they manage to produce a strong bear close, targeting the bottom of the trading range.
- Bulls who already hold a short position should maintain their longs as the best bears can achieve for now is a small pullback until the bottom of the trading range.
- Given the strength of the bull trend, bulls can securely hold their positions until a strong bear breakout of the trading range occurs.
- If bulls manage to secure a strong breakout of the trading range with good follow-through bars, traders who haven’t entered the bull market can consider entering.
- Deeper into the Price Action
- Looking at the chart, observe the bars on the left indicating a previous strong bull breakout with a breakout gap.
- Note that the breakout gap remains open, signaling strength for the bulls. An open gap suggests a potential measuring gap, indicating a move up based on the height of previous bull legs.
- Patterns
- Nifty 50 is currently trading within a bull channel. This channel is narrow, making it challenging for bears to profit on the weekly chart.
- If bears manage to produce a bear breakout of the bull channel, the increasing trading range price action can lead to a trading range on the weekly chart.
The Daily Nifty 50 chart

- General Discussion
- Market on the daily chart is trading inside a broad bull channel, enabling both bulls and bears to profit by buying low and selling high.
- Currently, the market is trading near the top of the broad bull channel, indicating caution for bulls in initiating new buys.
- If bears manage to form a strong bearish bar, they should consider selling and targeting the bottom trend line of the channel.
- Deeper into Price Action
- It’s important to note the abundance of inside bars and outside bars in the market, often accompanied by weak follow-through.
- Increasing numbers of inside and outside bars typically signal impending trading range price action.
- Despite the formation of strong inside and outside bars, it’s notable that the market fails to sustain momentum in the breakout direction, hinting at an imminent trading range.
- Patterns
- The market’s current position within a broad bull channel presents opportunities for both buyers and sellers to execute profitable trades.
- The prevalence of inside and outside bars in the market indicates a tendency towards trading range conditions.
Market analysis reports archive
You can access all weekend reports on the Market Analysis page.

