Market Overview: NASDAQ 100 Emini Futures
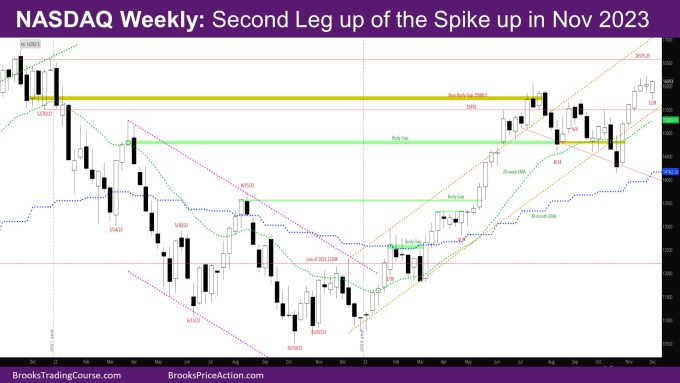
The NASDAQ Emini futures week is a bull bar closing near its high with a tail below. The market seems at the start of the second leg up of the spike up in Nov 2023.
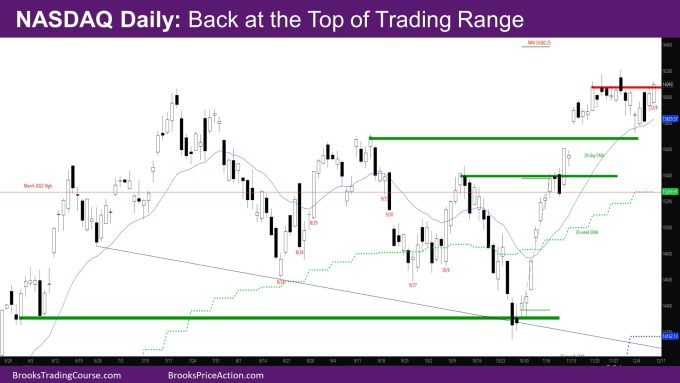
On the daily chart, the market tested the exponential moving average (EMA) on Monday and then ended the week as a 2-legged move up back to the high of the trading range of the past three weeks.
NASDAQ 100 Emini futures
The Weekly NASDAQ chart

- The week is bull bar with a tail below.
- The market tested the breakout point of 9/11 high and reversed.
- This week is a High 1 bull reversal bar.
- The body gap with July high close is still open.
- Bulls need a good entry bar next week.
- The next target for the bulls is the high close of 2021.
- Bears want a bar closing below the low of prior bar like they did in July, and then follow-through bars.
The Daily NASDAQ chart

- Friday is a bull trend bar closing near its high.
- The market closed above the November high close of 11/20.
- Bears want next Monday to reverse down again to continue the trading range.
- Bulls want a bull trend bar indicating the market is breaking out of the trading range of the past 3 weeks.
- Last week, bears had a good reversal bar with follow-through.
- Bears made money selling below that to the EMA.
- Bears sold again when the market reached that sell-signal bar on Wednesday.
- Inspite of the big bear bar on Wednesday, the market made a micro-channel whereby the low of every bar starting on Tuesday was higher than the day before.
- This should lead to a 2nd leg up, which means even if the market has a deep pullback, it should also make it back to the body of the Friday bar.
- The target for the bulls is the MM of the bodies of the November spike at 16382.25.
Market analysis reports archive
You can access all weekend reports on the Market Analysis page.

