Market Overview: EURUSD Forex
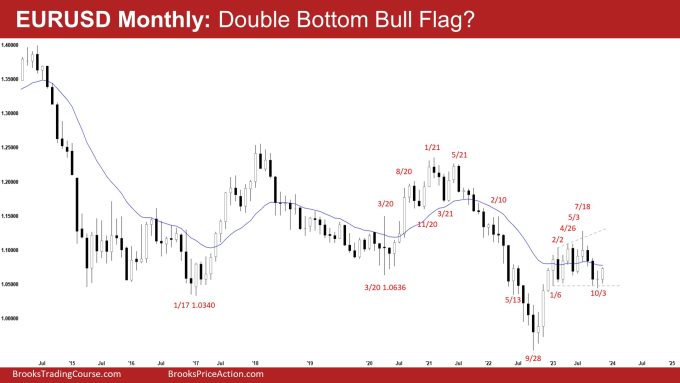
The monthly chart could be forming a EURUSD double bottom bull flag (Jan 6 and Oct 3). The bulls want November to be a bull bar closing near its high. The bears will need to create a breakout below the trading range low with follow-selling to increase the odds of a reversal.
EURUSD Forex market
The Monthly EURUSD Forex chart

- The October monthly EURUSD candlestick was a bull doji bar closing around the middle of the bar.
- The market traded below the September low but reversed to close above it.
- Previously, we said that the market may need to trade sideways to down to work off the overbought condition. It has done so.
- The bears got a reversal down from a wedge top (Feb 2, Apr 26, and Jul 18), a trend channel line overshoot, testing the trading range low (Jan low).
- While October broke below the trading range low, the bears were not able to get sustained follow-through selling.
- The bears need to create a breakout below the trading range with sustained follow-through selling to increase the odds of a reversal.
- The bulls want a reversal up from a double bottom bull flag (Jan 6 and Oct 3).
- They will need a strong entry bar in November by closing near its high preferably above October high to increase the odds of the bull leg beginning.
- Since October is a doji bar, it is a neutral candlestick.
- The move down in the last 3 months has also alleviated the prior overbought conditions.
- Most breakouts from trading ranges fail. Until the bears can create a breakout with follow-through selling, odds slightly favor the trading range to continue.
- For now, traders need more information. That means more candlestick.
- Traders will see if the bulls can create a strong bull bar in November. If they do, it will increase the odds of the bull leg beginning.
- However, if November closes as a doji or a bear bar with a long tail above, it may lead to a breakout attempt below the trading range (Jan/Oct) low.
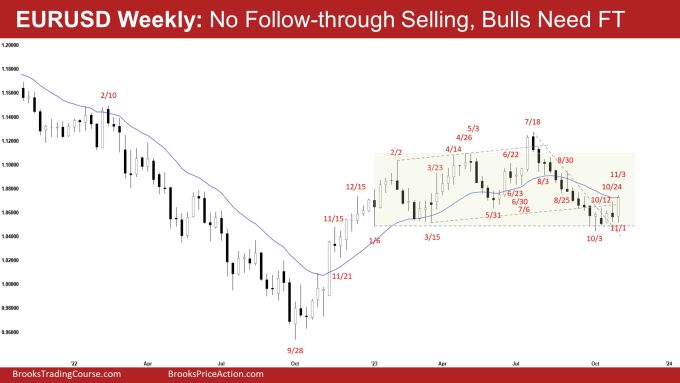
The Weekly EURUSD chart

- This week’s candlestick on the weekly EURUSD Forex chart was a big outside bull bar closing near its high.
- Last week, we said that traders will see if the bears can get a follow-through bear bar, or will the bears simply fail to get follow-through selling (like the third week of Oct)?
- This week traded a couple of pips below last week’s low but reversed into a big bull bar, closing slightly above the 20-week EMA. The bears failed to get follow-through selling.
- Previously, the bears got a tight bear channel testing the trading range low (Jan 6).
- They see the last 5 weeks simply as a pullback and want the market to resume lower, breaking far below the January low with follow-through selling.
- They want the pullback (bounce) to be weak (overlapping bars, doji(s), bear bars) and sideways, followed by another leg lower from a wedge bear flag (Oct 12, Oct 24, and Nov 3).
- The problem with the bear’s case is that they have not been able to create follow-through selling, and this week’s big bull bar is not a strong sell signal bar.
- The bulls hope that the strong move down from July is simply a sell vacuum within a trading range.
- They want a reversal up from a double bottom bull flag (with Jan 6) and a parabolic wedge (Aug 3, Aug 25, and Oct 3).
- So far, the pullback has a lot of overlapping bars. The bulls are not yet very strong.
- This week closed slightly above the 20-week EMA. They will need to create follow-through buying next week to increase the odds of a reversal.
- If the market trades lower in the next couple of weeks, the bulls hope that the current sideways trading range will be the final flag of the move down.
- Since this week’s candlestick is a big bull bar closing near its high, it is a buy signal bar for next week.
- For now, odds slightly favor the market to trade at least a little higher.
- If the bulls can get a couple of consecutive bull bars closing near their high, it will increase the odds of the bull leg beginning.
- Traders will see if the bulls can get follow-through buying or will next week trade slightly higher but continue to stall around the 20-week EMA area.
Market analysis reports archive
You can access all weekend reports on the Market Analysis page.

