Market Overview: Crude Oil Futures
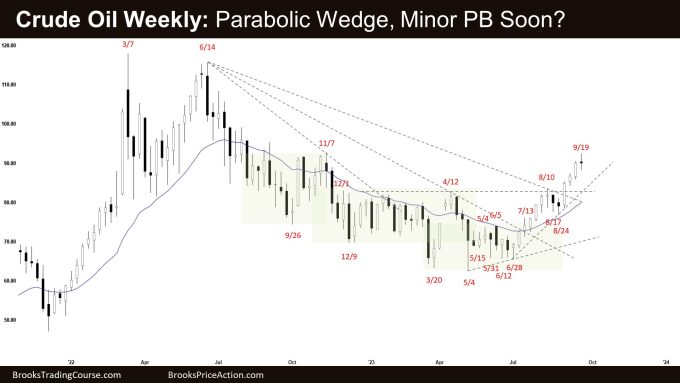
The weekly chart formed a Crude Oil climactic rally. While odds slightly favor the market to still be in the sideways to up phase, the move up since June has lasted a long time and is slightly climactic. A minor pullback can begin at any moment. The bears want a reversal down from a large double top bear flag with November 2022 high and a parabolic wedge (Jul 13, Aug 10, and Sept 19).
Crude oil futures
The Weekly crude oil chart

- This week’s candlestick on the weekly Crude Oil chart was a bear doji bar.
- Last week, we said that the odds slightly favor the market to still be in the sideways to up phase. However, the move up since June has lasted a long time and is slightly climactic. A minor pullback can begin at any moment.
- This week traded above last week’s high but closed below it. It could be the start of the pullback phase.
- The bears want a reversal down from a large double top bear flag with November 2022 high and a parabolic wedge (Jul 13, Aug 10, and Sept 19).
- The problem with the bear’s case is that the move up since June is in a tight bull channel. That means strong bulls.
- Any pullback would likely be minor and favor at least a small retest of the current leg high.
- Next week, the bears need to create follow-through selling to increase the odds of a deeper pullback.
- The bulls got follow-through buying following the breakout above the trading range high.
- They want a measured move based on the height of the 41-week trading range.
- If the market trades lower (pullback), they want a reversal up from a higher low, completing the larger wedge pattern with the first two legs being August 10 and September 19.
- Since this week’s candlestick was a doji bar, it is a neutral bar for next week.
- While odds slightly favor the market to still be in the sideways to up phase, the move up since June has lasted a long time and is slightly climactic. A minor pullback can begin at any moment.
- Traders will see if the bears can create follow-through selling next week or will the market trade slightly lower but close with a long tail below or a bull body.
- If there is a pullback, odds favor at least a small second leg sideways to up to retest the current leg high (now Sept 19).
- The bear trend lines becoming progressively less steep also indicates a loss of momentum for the bears.
- The market likely has flipped into Always In Long.
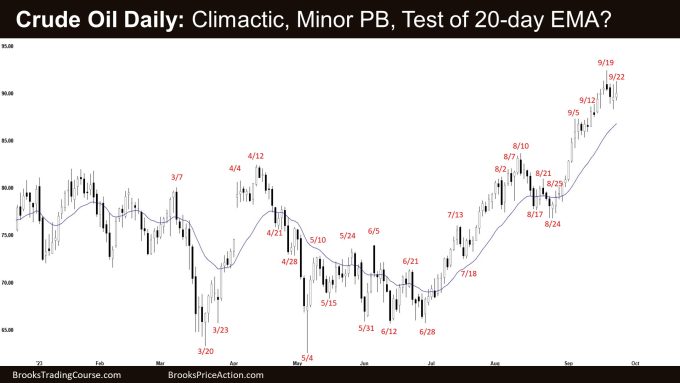
The Daily crude oil chart

- The market traded sideways for the week. Friday formed a small second leg sideways to up but reversed to close in the lower half of its range.
- Last week, we said that while the market continues to slightly favor sideways to up, the recent move up is slightly climactic. A minor pullback can begin at any moment.
- The bulls got a breakout above the 41-week trading range high with follow-through buying.
- The second leg up (from August low) is strong in the form of a spike and channel.
- They want a strong breakout followed by a measured move to around $103 based on the height of the 41-week trading range.
- If the market trades lower, they want the 20-day exponential moving average to act as support followed by a retest of the current leg high (now Sept 19).
- They want another strong leg up, completing the larger wedge pattern with the first two legs being August 10 and September 19.
- The bears want a failed breakout above the 41-week trading range and a reversal down from a smaller wedge (Sept 5, Sept 12, and Sept 19).
- The problem with the bear’s case is that the move up is very strong with strong bull bars while bear bars had limited follow-through selling.
- They need to create strong bear bars with follow-through selling to increase the odds of a deeper pullback.
- Because of the strong move up, odds slightly favor any pullback to be minor.
- While the market continues to slightly favor sideways to up, the recent move up is slightly climactic and has lasted a long time.
- A minor pullback can begin at any moment. It may have begun this week.
- If a pullback begins, a reasonable target for the bears would be the 20-day exponential moving average.
- Odds slightly at least a small second leg sideways to up to retest the current leg extreme (now Sept 19) after a pullback.
Market analysis reports archive
You can access all weekend reports on the Market Analysis page.

