Weekend report co-author Andrew A.
Market Overview: Weekend Market Analysis
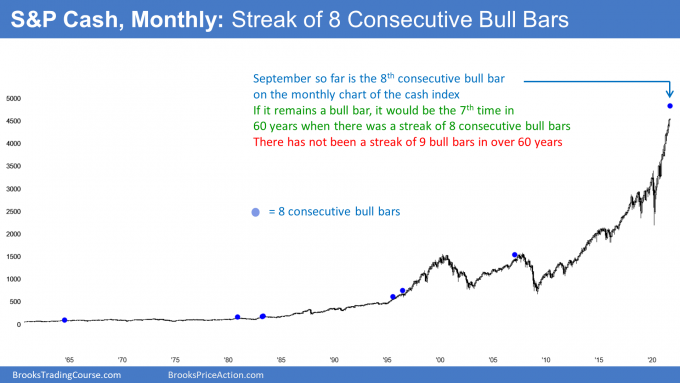
The SP500 Emini futures continue to trade higher as traders correctly buy every 1- to 3-day pullback expecting every reversal attempt to fail. September so far has 8 consecutive bull bars on the monthly chart of the S&P500 cash index. This is the 7th time when there was a streak of 8 bull bars. There has not been a streak of 9 bars in over 60 years. September or October should be a bear bar and the start of a 15 to 20% correction.
The EURUSD Forex is reversing higher from around the bottom of the yearlong trading range on the weekly chart. Bulls want at least 2 legs up over the next month or so. The bears want a break below November bottom of the range. With consecutive big bull bars closing near their highs and reversing up from the bottom of the range, the EURUSD should be sideways to up for several weeks.
EURUSD Forex market
The EURUSD monthly chart
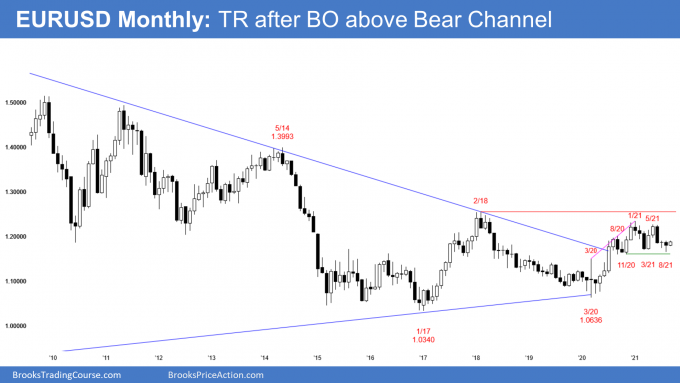
- This month’s candlestick on the monthly EURUSD Forex chart so far is a small bull bar that is barely breaking above last month’s high.
- August closed above the middle of the bar so it is a reversal bar and a buy signal bar. even though it has a bear body, The buy signal was triggered this week when the EURUSD broke above last month’s high.
- If the reversal up continues, it would be the start of a High 2 rally. This year’s selloff would then be just a pullback from the January high.
- The bears want a breakout below and a measured move lower, but the EURUSD has been in a yearlong trading range and that is likely to continue. Markets have inertia and tend to continue what they have been doing, and breakout attempts are likely to fail.
- In a trading range, traders Buy Low and Sell High. We should see more buyers than sellers at these lower levels.
The EURUSD weekly chart
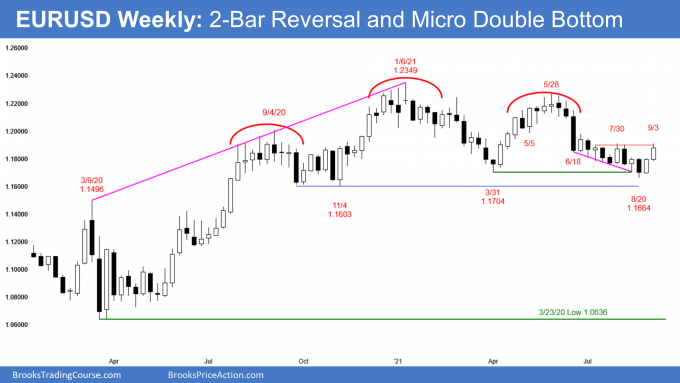
- This week’s candlestick on the weekly EURUSD chart was a bull bar with a noticeable tail above.
- The price tested a fraction of a pip above the July 30 high and pulled back slightly.
- This week was a successful entry bar following last week’s bull signal bar.
- The bulls will need at least another bull follow-through bar next week to convince traders that this is more than a pullback in a bear channel.
- The bears want the EURUSD to turn lower from a Double Top Bear Flag from around July 30 high or June 25 high.
- On the daily chart (not shown) price is in an 11-bar tight bull channel which is a sign of bullish strength, turning higher from a lower low major trend reversal.
- The bears want a breakout below August’s low, and then below the November 2020’s low, followed by a measured move down.
- However, with the bullish strength over the last 2 weeks, odds favor a second leg sideways to up once we get a pullback
- The EURUSD has been in a year-long trading range. In a trading range, traders Buy Low and Sell High so there will probably be buyers below the August and November lows.
- Most breakouts from trading ranges fail. Markets have inertia and tend to continue what they have been doing.
- Therefore, the yearlong trading range is likely to continue. That means there should be a rally for a couple of months beginning around the current level or from just below the August or November low.
S&P500 Emini futures
The Monthly S&P500 Cash Index
The Monthly Emini chart
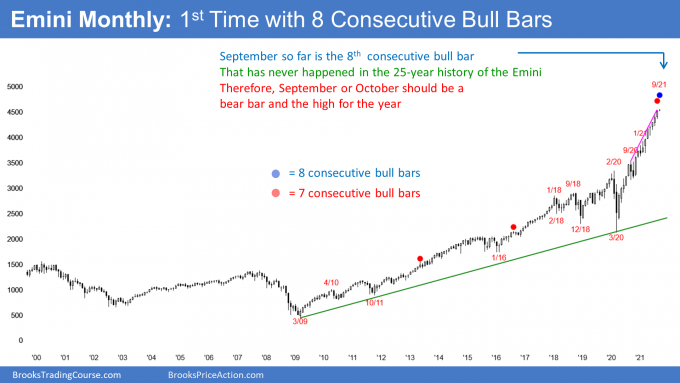
- September so far is the 8th consecutive bull bar on the monthly chart of the S&P500 cash index. This is the 7th time when there was a streak of 8 bull bars. There has not been a streak of 9 bars in over 60 years. September or October should be a bear bar.
- If it is, it should lead to a 2- to 3-month month correction of 15 to 20%.
- If September is a bear bar, September could rally in the 1st half of the month and then sell-off late in the month. The September 22 FOMC meeting is a potential catalyst.
- The Emini reached the 4537 measured move this week. That target is based on the height of the pandemic crash.
- The bears have not yet been able to create a bear bar or even a bull bar with a prominent tail on top for 7 months. This is a sign of eager and relentless buying.
- Sometimes in a buy vacuum test of resistance, sellers stop selling until the price reaches the target. At that point, the bears sometimes sell aggressively and the bulls take profits. We will find out over the next couple months if this rally is simply a buy vacuum test of the 4537 measured move target.
The Weekly S&P500 Emini futures chart
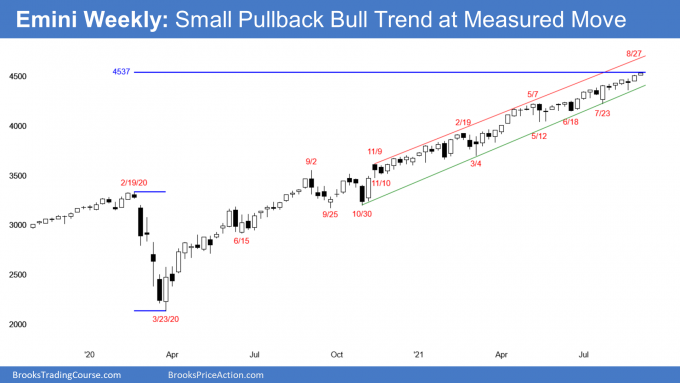
- This week’s candlestick on the weekly Emini chart was a small bull bar with a small tail above.
- Price gapped up by a few ticks, and the gap remained open.
- The next targets for the bulls are the top of the weekly trend channel line at around 4600 and measured move at 4967 (not shown) based on the pandemic low to the September 2, 2020 high.
- Should the Emini break above the trend channel line, there is a 75% chance that the breakout will fail within by about 5 bars and the Emini will reverse back to at least the middle of the channel. However, those 5 bars can still be still very big, especially if it is a climax reversal.
- The Emini has been in a Small Pullback Bull Trend for more than 60 bars, which is unusual, and therefore unsustainable and climactic.
- A Small Pullback Bull Trend ends with a big pullback. The biggest pullback so far was the 10% selloff in September 2020. A bigger pullback means 15 to 20%.
- The bears have not been able to create consecutive big bear bars.
- The rally is in a tight bull channel, which is a sign of strong bulls.
- Until the bulls aggressively take profits, the bears will not sell. The bears need to see one or more big bear bars before they will look for a 2- to 3-month correction.
- Until then, traders will continue to bet on higher prices and that every reversal attempt will fail.
- The 2 common ways for a tight bull channel to end are either with a break below the bull trend line (bottom of the channel) or a failed breakout above the channel.
- When a tight channel lasts an unusually long time, some bears who have been scaling in and using wide stops can no longer sustain the growing losses. That occasionally leads to a violent short-covering rally and brief break above the channel.
- Once the last bear buys back his shorts, there is no one left to buy at those extremely high prices. Bulls see the big rally as an opportunity to take windfall profits.
- With no one buying and bulls selling, there can be a climactic reversal down (blow-off top). That is what happened in the bond market last year.
The Daily S&P500 Emini futures chart
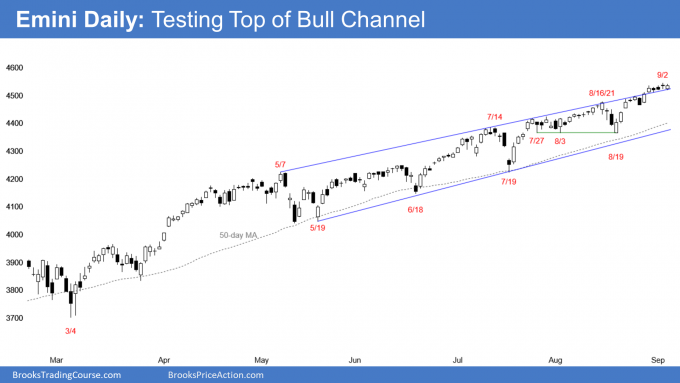
- Despite making new highs this week, the Emini traded mostly sideways all week and all of the bars were small.
- It is just above the top of the channel. Traders are deciding if it will accelerate up or reverse down. With the trend as strong as it it, it should go at least slightly higher.
- Trend channel line overshoots tend to lead to a pullback into the channel, which could happen soon.
- Bulls want a big breakout above, and then an even stronger bull trend. That happens 25% of the time, and it happens because traders who have been selling for the past 20 – 30 bars (days) finally give up. 75% of the time, a breakout above the top of a bull channel fails by about the 5th bar.
- If the bears get a reversal down within a week, it will be from a higher high major trend reversal and from an expanding triangle that began with the July 26 high.
- The bull trend has been very strong, and therefore traders expect all resistance to fail. Traders will continue to buy every 1- to 3-day pullback until one is so big that traders will conclude that a correction is underway.
- There have been many reversals attempts on the daily chart over the past year and a half. Traders bought every one, correctly betting against a successful reversal.
- While the trend has been overextended and extreme, bulls continue to bet on higher prices because they know that most reversal attempts fail in a strong trend.
- Traders need to see aggressive profit-taking and consecutive big bear bars closing near their lows before they will be willing to short aggressively. Traders will not believe a correction is underway until it is already about half over.
Trading Room
Traders can see the end of the day bar-by-bar price action report by signing up for free at BrooksPriceAction.com. I talk about the detailed Emini price action real-time throughout the day in the BrooksPriceAction.com trading room. We offer a 2 day free trial.
Weekly Reports Archive
You can access all weekly reports on the Market Analysis page.

