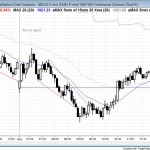
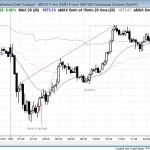
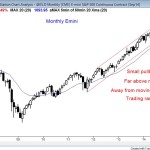
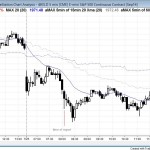
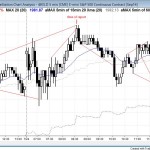
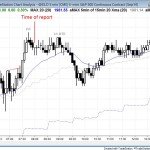
I posted this chart after the close. Yesterday formed a huge bear breakout on the daily stock market charts. After an early, big rally today, the Emini fell to a new low of the day. Whenever a rally goes that far above the open, there is a lot of buying pressure, and that reduces the […]
If you are not seeing the latest Weekly Report below, your PC/device browser is likely showing you an earlier page copy. Simply refresh your browser. For PCs you can use the F5 key, or Ctrl-F5, several times if needed.
Intraday market update, Thursday, July 31, 2014: gap down and breakout below monthly support
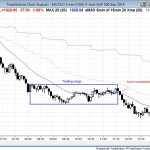
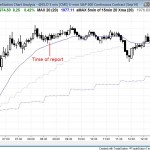
I posted this Emini chart after the close. The Emini gapped down and then entered a trading range from 8:00 am to 11:30 am. This was followed by bear trend resumption into the close. The daily and 60 minute charts are always in short. The breakout was very strong and will probably have at least […]
Intraday market update, Wednesday, July 30, 2014: failed bull breakout on an FOMC report day
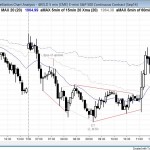
I posted this chart after the close. The Emini sold off early and fell below last week’s low and the open of the month. It then reversed up from an expanding triangle bottom, which is always a lower low major trend reversal. There was an 11:00 am FOMC report. The bear breakout below the triangle […]
Intraday market update, Tuesday, July 29, 2014: wedge top bear trend reversal
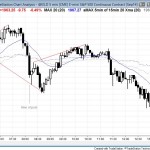
I posted this chart after the close. The Emini had a wedge top bear trend reversal after yesterday’s final flag. The Emini and S&P500 then reversed up from a wedge bottom. The Emini formed a wedge lower high major trend reversal and then trended down into the close. The overall pattern was very similar to […]
Intraday market update, Monday, July 28, 2014: bull trend reversal
I posted the chart after the close. The Emini sold off and tested last week’s low, and then reversed up from a small wedge bottom. It formed a higher low major trend reversal at 9:45 am, and then rallied to a new high of the day, but failed to get above yesterday’s high. Today bounced […]
Emini weekly update: Sunday, July 27, 2014: Possible buy climax in an overbought bull trend
The Emini weekly chart is at the top of the channel and it is forming a possible buy climax in an overbought bull trend. Three weeks ago, the weekly Emini had a small breakout above the top of the channel, and this week, it briefly broke above a measured move target (for the projection, I […]
Intraday market update, Friday, July 25, 2014: island top in the stock market
The Emini had a wedge bear flag below the moving average on the open, and the opening range was about half of an average day’s range. This is a setup for a measured move up or down and a trending trading range day. The bear breakout below the bottom of the wedge was the entry […]
Intraday market update, Thursday, July 24, 2014: bull trend opening reversal
I posted this chart after the close. After a bull trend opening reversal at 7:05 am PST, the Emini made a new high, but it formed a parabolic wedge and an expanding triangle top. This resulted in a deep pullback that ended with a parabolic wedge bottom at 10:10 am. It sold off from a […]
Intraday market update, Wednesday, July 23, 2014: bull trend opening reversal
I posted this chart after the close. The bulls had a bull trend opening reversal at the moving average, but the market then had a parabolic wedge top at 7:45 am. This was followed by a small lower high major trend reversal. It formed as a small double top in a tight trading range, as […]
Intraday market update, Tuesday, July 22, 2014: breakout to an all time high
I posted this chart after the close. The Emini and stock market broke to a new all time high, but the breakout and follow-through were weak. The market entered a tight trading range. The bears were able to test the open of the day in the final hour, but the Emini worked back up into […]
