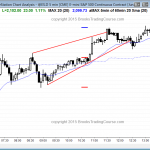
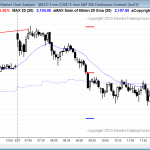
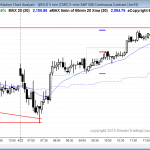
Posted 7:05a.m. Yesterday ended with a 60 minute spike and channel bottom. The odds favor a 2 legged rally today on the 60 minute chart. This means that bulls will look to buy a pullback. Since the 60 minute chart is in a trading range, the pullback can be deep. Yesterday’s 60 minute bear channel […]
If you are not seeing the latest Weekly Report below, your PC/device browser is likely showing you an earlier page copy. Simply refresh your browser. For PCs you can use the F5 key, or Ctrl-F5, several times if needed.
Intraday market update: May 1, 2015
Intraday market update: April 30, 2015
Price action trading strategy in breakout mode
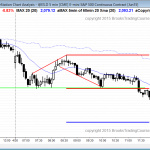
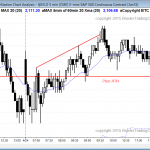
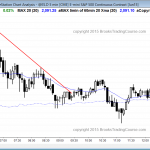
Posted 7:11 a.m. The Emini futures contract sold off on the open and tested last week’s low. This makes the week almost an outside down week, and last week’s breakout above the 3 month trading range on the weekly chart has failed. Although the bears have a reasonably strong breakout on the open and the […]
Intraday market update: April 29, 2015
Day trading tip is to trade the big move off the FOMC report
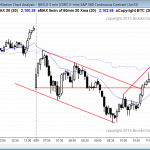
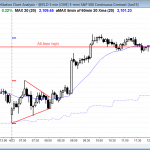
Posted 7:01 a.m. The Emini opened with a gap down and then a big reversal up. There were several days early in the month where there were big rallies and big bars on the open. Most quickly went sideways and some reversed. The Emini is Always In Long, but there have been several big reversals […]
Intraday market update: April 28, 2015
Day trading tip is to look for a 2 hour swing trade up
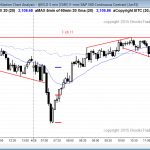
Posted 6:51 a.m. The bears got follow-through selling on the open, but the probability is that it will not last more than an hour. At that point, the bulls probably will take control for at least a couple of hours. Swing traders will look for a buy setup at any time in the first couple […]
Intraday market update: April 27, 2015
Trading strategies for a gap up to a new all time high
Posted 7:09 a.m. The Emini futures contract gapped up, but closed the gap on the 2nd bar. However, the tails below bars and the early bull bar made it more likely that this was a bear leg in what would become a trading range. The bulls created an opening reversal up from support (the moving […]
Emini weekend update: April 25, 2015:
Futures trading strategy at a new high
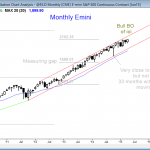
Monthly S&P500 Emini futures candle chart: Futures trading strategy at a new high The monthly Emini futures candle chart had a bull breakout of the ioi pattern. There are 4 days left to the month, and the bulls want this month’s candle to be big so that traders will see the breakout as strong. The […]
Intraday market update, April 24, 2015:
Learn how to trade the market at a new high
Posted 6:54 a.m. The S&P Emini futures contract was likely to have a 2nd leg down after the strong selloff into yesterday’s close, and today’s open satisfied that minimum goal. Although a strong bear trend day is possible, yesterday had a 3 hour trading range after a strong rally, and this selloff is more likely […]
Intraday market update, April 23, 2015:
Day trading tip is to expect a trading range
Posted 6:53 a.m. The Emini tested the 60 minute moving average and the bottom of the channel on the open, but the selloff from yesterday’s high was only about 10 bars and that is probably not enough to correct a rally that lasted 60 bars. Yesterday was an outside day at the top of the […]
Intraday market update, April 22, 2015:
Daytraders expect more trading range price action
Posted 6:55 a.m. The S&P Emini futures contract sold off on the open and created a trend from the open bear trend. It fell below yesterday’s higher low, which is a sell signal. However, the price action for two days has been one of failed breakouts, so the down side might be limited to a […]
Intraday market update, April 21, 2015:
Futures trading strategy is to be ready for a trend
Posted 6:52 a.m. The Emini futures contract opened with a gap up, but it immediately sold off to the moving average. The bulls are hoping for an opening reversal up and the low of the day, but the selling was strong enough up so that the first rally will probably result in a trading range […]

