Posted 7:15 a.m. The Emini rallied from the open and is Always In Long. However, bear scalpers have been making money with limit orders, which increases the chances that the rally might have a deep pullback or that there might be a trading range soon. The bulls need to get strongly above the moving average […]
If you are not seeing the latest Weekly Report below, your PC/device browser is likely showing you an earlier page copy. Simply refresh your browser. For PCs you can use the F5 key, or Ctrl-F5, several times if needed.
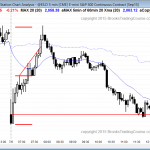
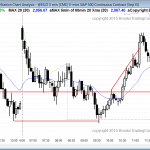
Intraday market update: July 6, 2015
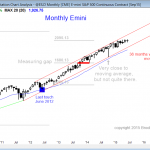
Emini weekend update: July 4, 2015:
Price action trading strategies for a buy climax
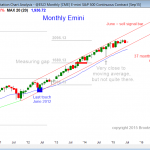
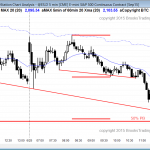
Monthly S&P500 Emini futures candlestick chart: Strong bull trend, but now in tight trading range The monthly S&P500 Emini futures candlestick chart had a strong bear trend bar last month, which is a sell signal bar in a buy climax. The monthly S&P500 cash index candlestick chart is in its 37th month without touching its moving average. […]
Intraday market update: July 2, 2015
Day trading strategies for a late rally
Posted 7:23 a.m. The Emini had an early sell setup for the 2nd entry on the failed breakout above yesterday’s high, but it formed in a tight trading range and in a tight bull channel. Although this is a possible high of the day, the odds are that there will be buyers late in the […]
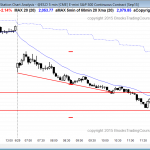
Intraday market update: July 1, 2015
Learn how to trade breakout mode price action
Posted 7:25 a.m. The Emini gapped up above yesterday’s high and created a two day island top. The bears want the breakout above the neckline of the 60 minute double bottom to fail. This would be a type of wedge bear flag. However, the dominant force working on the market is the sell climax. After […]
Intraday market update: June 30, 2015
Learn how to trade a pullback
Posted 6:56 a.m. The Emini gapped up to around a 50% pullback of yesterday’s range and got immediate follow-through selling. However, the gap up was so big that the odds favor a trading range day (big down, big up, big confusion). Although the Emini is Always In short, bulls will look for an opening reversal […]
Intraday market update: June 29, 2015
Learn how to trade a breakout
Posted 7:01 a.m. The bulls reversed up strongly enough from the big gap down to make the Emini Always In Long. However, the follow-through on the 2nd and 5th bars was bad and it increases the chances of an early trading range. The bulls want to close the gap below yesterday’s low as a sign […]
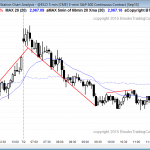
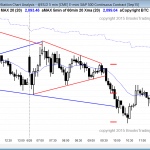
Emini weekend update: June 27, 2015:
Price action trading strategy for bearish candlestick pattern
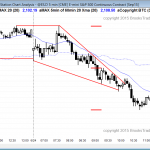
Monthly S&P500 Emini futures candlestick chart: 80% chance of 10% pullback this year The monthly S&P500 Emini futures candlestick chart is extremely overbought, but there is no sign of a top. This month’s candlestick closes on Tuesday, and it might be a bear inside bar and therefore a sell signal bar. The monthly S&P500 Emini […]
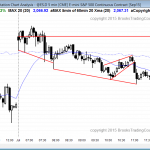
Intraday market update: June 26, 2015
Learn how to trade a sell climax
Posted 7:15 a.m. The Emini had a strong opening reversal up from below yesterday’s low and reversed down from the bear trend line and from above the trading range. There is a 70% chance that we’ve seen the low of the day and probably an 80% chance that the Emini will close above the open, […]
Intraday market update: June 25, 2015
Learn how to trade a reversal
Posted 7:00 a.m. The Emini had strong follow-through selling on the open from an expanding triangle bear flag. The bulls now need an expanding triangle bottom to begin to achieve their goal of at least 2 hours of sideways to up trading. Because of the dojis and big tails on the reversal up, sideways for […]
Intraday market update: June 24, 2015
Day trading for beginners in a trading range
I will post around 7:30 a.m. The week or two before the 4th of July is usually the 2nd quietest time of the year (Christmas week is the quietest), and trading this week has had a lot of small legs and reversals, and many sideways bars with prominent tails. This is holiday trading. However, there […]

