Posted 7:32 a.m. The Emini reversed down from its test of yesterday’s high with 3 consecutive bear bars, making the Emini Always In Short. The bars had prominent tails and lacked big bodies, increasing the chances that it will not get far. It then had a Low 2 short below the moving average and the […]
If you are not seeing the latest Weekly Report below, your PC/device browser is likely showing you an earlier page copy. Simply refresh your browser. For PCs you can use the F5 key, or Ctrl-F5, several times if needed.
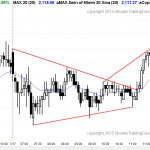
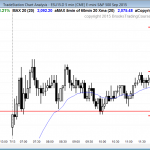
Emini market update: July 17, 2015
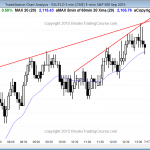
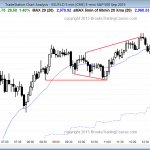
Intraday market update: July 16, 2015
Learn how to trade a test of the high
Posted 7:40 a.m. The Emini opened with a gap up to the top of yesterday’s channel. The bears wanted an expanding triangle top and early high of the day. The bulls wanted a test of the gap or of the moving average and then an opening reversal up and an early low of the day. […]
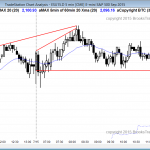
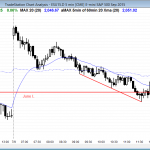
Intraday market update: July 15, 2015
Daytraders will look for trend reversal candlestick patterns
I will post around 7:48 a.m. The Emini began with a limit order market and it has been in a broad bull channel. The odds favor a swing down at some point today once this rally exhausts itself, which will probably be within the next hour, but the bears need to wait for a credible […]
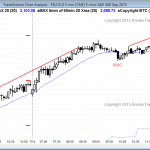
Intraday market update: July 14, 2015
Candlestick pattern is a tight trading range
Posted 7:35 a.m. The Emini began with a trend from the open bull trend, but the bars were not big and they formed as a continuing of yesterday’s weak rally. Also, the rally was a bull breakout above a bull channel, which usually fails. The odds are that the Emini will transition into a trading […]
Intraday market update: July 13, 2015
Learn how to trade the markets when there is a gap up
Posted 7:38 a.m. The Emini closed the June 29 gap on the daily chart and formed a trend from the open bull trend. However, the follow-through was bad and it was a limit order open. Traders bought below bars, sold above, and scalped. When there is a breakout mode open, the probability for a stop […]
Emini weekend update: July 11, 2015:
Emini and stock market trading at support
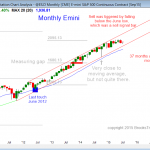
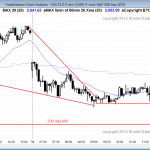
Monthly S&P500 Emini futures candlestick chart: Triggered the sell signal, but needs strong entry bar The monthly S&P500 Emini futures candlestick chart triggered a sell signal by falling below last month’s low, but the bears need a strong entry bar. There is still a long time before this month’s candlestick closes, and it could even […]
Intraday market update: July 10, 2015
Learn how to trade futures as a swing trader
Posted 7:15 a.m. The Emini opened with many dojis. This is a trading range open, and it increases the chances that the Emini will go sideways to down to the moving average and then bounce and enter a trading range. It also increases the chances that today will spend a lot of time within tight […]
Intraday market update: July 9, 2015
Intraday trading techniques at support
Posted 7:35 a.m. The Emini opened with a big gap up, but closed the gap above yesterday’s high within the first 15 minutes and entered a tight bear channel. When there is a big gap up, the Emini usually has to go sideways to down until it gets closer to the moving average, which is […]
Intraday market update: July 8, 2015
Best candlestick patterns need follow-through
Posted 7:15 a.m. The Emini opened in the middle of yesterday’s range and began with a trend from the open bear trend. The bears want another breakout below the June low for another monthly sell signal. The bulls expect that this is a trading range day and expect that the test down is a bear […]
Intraday market update: July 7, 2015
Learn how to trade futures after a sell climax
Posted 7:19 a.m. The Emini began with a trend from the open bear trend, but yesterday was a trading range, and the bulls are hoping this is just a sell vacuum test of yesterday’s low and the June low. The selloff fell below last week’s low and triggered the monthly sell signal, but the odds […]

