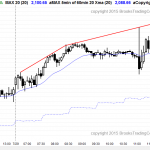
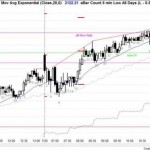
Posted 7:13 a.m. Yesterday ended with a tight trading range, and today opened with sideways bars, prominent tails, and reversals. This increases the chances of trading range price action today before the 11 a.m. report. It is still Always In Long, but in breakout mode. The Emini reversed down from a 50% pullback of the […]
If you are not seeing the latest Weekly Report below, your PC/device browser is likely showing you an earlier page copy. Simply refresh your browser. For PCs you can use the F5 key, or Ctrl-F5, several times if needed.
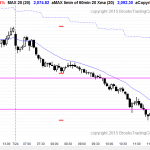
Emini market update: July 29, 2015
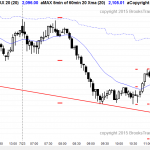
Emini market update: July 28, 2015
Trading price action in a trading range
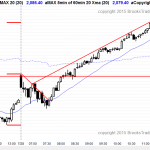
Posted 7:19 a.m. The Emini opened with a trend from the open bear trend. Since the selloff fell almost 9 points, which is a lot, and the 60 minute moving average is just above, the odds of a bull trend day are less. Because the 60 minute chart is so oversold and tomorrow is an […]
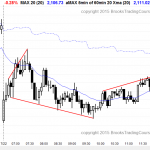
Emini market update: July 27, 2015
Candlestick pattern is an island top
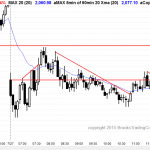
Posted 7:37 a.m. Thursday and Friday formed early double top bear flags that broke below the low of the day and were followed by bear trend days. Today also formed an early double top bear flag, but the 60 minute chart is so oversold that bears have to reduce position sizes by buying back some […]
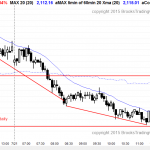
Emini weekend update: July 25, 2015:
Swing trading strategies when a breakout is likely
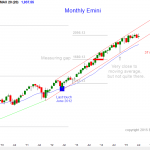
Monthly S&P500 Emini futures candlestick chart: Candlestick pattern will be clearer next week The monthly S&P500 Emini futures candlestick chart is in the middle of its 5 month trading range, and the candlestick pattern today is a doji. The chart is in breakout mode. The monthly S&P500 Emini futures candlestick chart has been above its moving […]
Emini market update: July 24, 2015
Trading price action after a sell climax
I will post around 7:29 a.m. The Emini had follow-through selling on the open, and the selling often lasts for an hour or two. While it is possible to last all day, that is unlikely. More likely, the bulls will create a good buy signal bar within the next hour, and then there will be […]
Intraday market update: July 23, 2015
Day trading tip is to expect another leg up
Posted 7:43 a.m. The bears had a trend from the open bear trend, but failed to get below yesterday’s low, which was the bottom of the bull reversal. The bulls then formed a higher low major trend reversal, but failed to get above the top of the bear leg. The buy signal bar was big […]
Emini market update: July 22, 2015
Trading price action in a pullback
Posted 7:23 a.m. The bulls reversed the Emini up from below yesterday’s low, triggering an expanding triangle bottom on the 5 minute chart and closing the gap down. The rally has been weak and this increases the chances of a deep pullback and then a trading range. Although it is possible for the Emini to […]
Emini market update: July 21, 2015
Day trading tip is to look for a pullback
Posted 7:41 a.m. The Emini opened within yesterday’s tight trading range, and it was above the support magnets and below the moving average. It formed a wedge bear flag at the moving average, which was an opening reversal sell signal for a possible high of the day. The minimum targets were the 60 minute moving […]
Emini market update: July 20, 2015
Candlestick pattern is a double top
Posted 7:15 a.m. The daily chart has a 9 bar bull micro channel and is therefore overbought. It is also at the top of the 6 month trading range, which is resistance. There were no bull bodies in the first 4 bars, and the Emini was Always In Short from the 2nd bar. The odds […]
Emini weekend update: July 18, 2015:
Traders learning how to trade the markets can see a strong rally
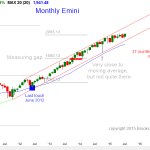
Monthly S&P500 Emini futures candlestick chart: Overbought, but no sign of a top The monthly S&P500 Emini futures candlestick chart is still in a tight trading range. It has not touched the moving average for 37 months, and this type of price action is a form of a buy climax. The monthly S&P500 Emini futures […]

