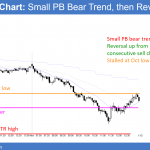
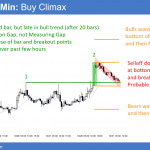
President Trump stock market rally Updated 6:55 a.m. While the Emini gapped up and began with a Trend From the Open, Buy The Close Bull Trend, it is at the top of a 15 minute bull channel. There is only a 25% chance of success. Hence, there is a 75% chance of a sideways to […]
If you are not seeing the latest Weekly Report below, your PC/device browser is likely showing you an earlier page copy. Simply refresh your browser. For PCs you can use the F5 key, or Ctrl-F5, several times if needed.
President Trump stock market rally
Trump Presidential election stock market correction
Intraday market update: November 9, 2016
Trump Presidential election stock market correction Updated 7:13 a.m. The Emini had a big reversal up from yesterday’s low. It then tested yesterday’s high and sold off. Because of the several reversals, today will probably be a trading range day. Since the bars are big, most traders should wait until they become smaller. At the […]
Presidential election year end rally attempt
Intraday market update: November 8, 2016
Presidential election year end rally attempt Updated 6:48 a.m. The Emini tried to reverse up from a test of yesterday’s buy climax low. Yet, the big down open created a Big Up, Big Down pattern. Hence, there is increased uncertainty. Therefore, a trading range is likely. The bulls want a double bottom and then a […]
Presidential election rally after sell climax
Intraday market update: November 7, 2016
Presidential election rally after sell climax Updated 6:49 a.m. The Emini had a big gap up on the open. When there is a huge gap up, the day usually goes sideways for several hours at some point, and rarely closes far above the open. About 20% of the days become strong bull trend days or […]
Year end rally after presidential election
Emini weekend update: November 5, 2016
Monthly S&P500 Emini futures candlestick chart:Exhaustion gap The monthly S&P500 Emini futures candlestick chart finally pulled back below the July 2015 high. The July 2016 breakout is therefore an exhaustion gap. The monthly S&P500 Emini futures candlestick chart has pulled back for 3 months. I have been writing since the July breakout that the breakout […]
Stock market election selloff should test 2050 support
Intraday market update: November 4, 2016
Stock market election selloff should test 2050 support Updatted 6:47 a.m. The Emini reversed up on the 1st bar, forming a double bottom with yesterday’s low. Furthermore, yesterday reversed up from a 3 day wedge bottom on the 15 minute chart. Therefore, the Emini will probably go sideways to up for about 10 bars on […]
FOMC stock market rally on unchanged interest rates should fail
Intraday market update: November 3, 2016
FOMC stock market rally on unchanged interest rates should fail Updated 6:43 a.m. While yesterday reversed up from a higher low major trend reversal, just above the July 2015 high, the 1st bar today was a doji within a 3 hour trading range. That 1st doji and the 3 hour range and the magnet below […]
Presidential election selloff through 2100 support
Intraday market update: November 2, 2016
Presidential election selloff through 2100 support Updated 6:43 a.m. Because of yesterday’s reversal, today will probably be a trading range day. This is especially true because most days for 4 months have been trading range days. Furthermore, today’s FOMC announcement at 11 a.m. creates added uncertainty. The odds are very high that the Fed will […]
Stock market ignoring FBI investigation of Clinton emails
Intraday market update: November 1, 2016
Stock market ignoring FBI investigation of Clinton emails Updated 6:53 a.m. The Emini opened in the middle of yesterday’s range and the 1st bar had prominent tails above and below. It did nothing to change the minds of traders. It therefore increased the odds that yesterday’s limit order market trading will again be common today. […]
Stock market election volatility
Intraday market update: October 31, 2016
Stock market election volatility Updated 6:42 a.m. The day began with 2 small dojis near the top of yesterday’s trading range. These bars increase the chances of a lot of trading range price action today. Resistance above is at the 60 minute moving average and the August 2 low. Support below is at the bottom […]
