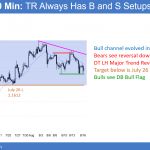
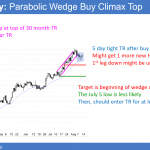
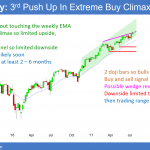
Emini awaiting catalyst, like North Korea missile decision Updated 6:49 a.m. The Emini opened above yesterday’s high, but immediately closed the gap. Because yesterday was a small day, the bears will try to trade below yesterday’s low to create an outside down day. The bulls see the tails below the 1st 3 bars and hope […]
If you are not seeing the latest Weekly Report below, your PC/device browser is likely showing you an earlier page copy. Simply refresh your browser. For PCs you can use the F5 key, or Ctrl-F5, several times if needed.
Emini awaiting catalyst, like North Korea missile decision
Emini failed bear breakout after North Korea correction attempt
Intraday market update: August 15, 2017
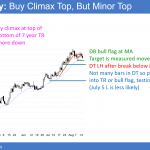
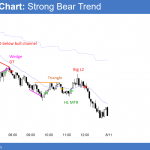
Emini failed bear breakout after North Korea correction attempt Updated 6:44 a.m. The Emini opened above yesterday’s high and immediately pulled back. The bulls want an opening reversal up from the moving average. Yet, since a lower high is likely on the daily chart, bears see the current price as a good price to sell. […]
Emini trend reversals need follow-through selling
Intraday market update: August 14, 2017
Emini trend reversals need follow-through selling Updated 6:45 a.m. The Emini gapped up and had 2 strong bull bars on the open. The Emini is Always In Long and this is enough strength and the context is good enough to make a bear trend unlikely. The odds are that today will either remain a bull […]
Trump and North Korea are catalysts for 5% technical correction
Emini weekend update: August 12, 2017
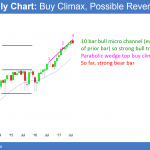
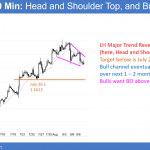
Monthly S&P500 Emini futures candlestick chart:Trump and North Korea are catalysts for 5% technical correction Each bar for the past 9 months on the monthly S&P500 Emini futures candlestick chart has had a low above the low of the prior month. This is therefore a 10 bar bull micro channel. The monthly S&P500 Emini futures […]
North Korea is catalyst for 5% stock market correction
Intraday market update: August 11, 2017
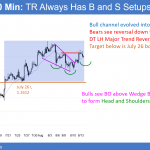
North Korea is catalyst for 5% stock market correction Updated 6:48a.m. Today opened within the tight range at yesterday’s close. The gap below is a magnet, and the bear trend line above is as well. Since an early trading range is likely, the Emini will probably test both in the 1st 2 hours. It is […]
Emini buy climax and North Korea catalyst
Intraday market update: August 10, 2017
Emini buy climax and North Korea catalyst Updated 6:51 a.m. The Emini sold off on the open, but it is at the bottom of a month-long trading range. Yesterday was a good bull bar on the daily chart. Today opened near yesterday’s low. If today closes on its low, that combination would be a strong […]
Emini trend reversal after failed new high breakout
Intraday market update: August 9, 2017
Emini trend reversal after failed new high breakout Updated 6:52 a.m. The Emini traded below last week’s low. This week is therefore an outside down week. The bears need the week to close far below last week’s low. The bulls want the opposite. The Emini had a failed reversal up on the open. It reversed […]
Emini buy climax is waiting for a catalyst
Intraday market update: August 8, 2017
Emini buy climax is waiting for a catalyst Updated 6:53 a.m. Yesterday reversed down from above last week’s high at the end of day. Today, the bulls are trying to reverse the Emini up from below yesterday’s low and the 60 minute moving average. The Emini is Always In Long. Yet, the Emini has been […]
Emini buy climax awaiting next catalyst
Intraday market update: August 7, 2017
Emini buy climax awaiting next catalyst Updated 6:53 a.m. Today began with a continuation of Friday’s tight range. This therefore increases the chances of another mostly trading range day. Yet, since Friday was so extremely tight, day traders will watch for a breakout into a trend day today. The 3 week range is still above […]
Emini risk from low volatility, algorithms, and central banks
Emini weekend update: August 5, 2017
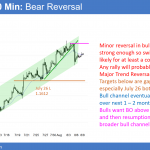
Monthly S&P500 futures candlestick chart:9 bar micro channel The monthly S&P500 cash index is at a measured move up from the 2002 and 2009 double bottom. Every bar for the past 9 bars on the monthly chart has a low at or above the low of the prior month (cannot see on this bar chart). […]
