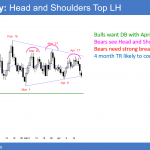
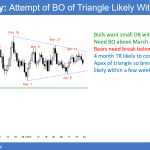
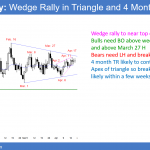
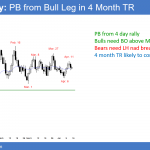
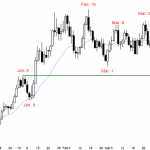
Emini weekly sell signal bar at 2700 Big Round Number resistance I will update again at the end of the day Pre-Open market analysis Last week closed below its open and therefore was a reversal bar on the weekly chart. Although it had a bear body, it was not a big bear bar closing on […]
If you are not seeing the latest Weekly Report below, your PC/device browser is likely showing you an earlier page copy. Simply refresh your browser. For PCs you can use the F5 key, or Ctrl-F5, several times if needed.
Emini weekly sell signal bar at 2700 Big Round Number resistance
Weak Emini breakout above 2700 Big Round Number on strong earnings
Emini weekend update: April 21, 2018
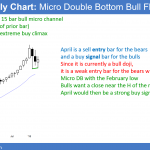
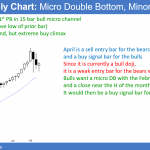
Monthly S&P500 Emini futures candlestick chart: April is reversing up after a 3 month bull flag The monthly S&P500 Emini futures candlestick chart so far this month has a bull reversal bar. If it closes near its high, it will be a strong buy signal bar for May. The monthly S&P500 Emini futures candlestick chart […]
Emini island top after island bottom in 3 month trading range
Intraday market update: April 20, 2018
Emini island top after island bottom in 3 month trading range I will update again at the end of the day Pre-Open market analysis I said before the open yesterday that there was an increased chance of a bear trend day after 3 days in a tight bull channel on the 5 minute chart. Furthermore, […]
Emini island bottom reversal up to 2800 by May
Intraday market update: April 19, 2018
Emini island bottom reversal up to 2800 by May I will update again at the end of the day Pre-Open market analysis The Emini sold off early yesterday and then reversed up. It then spent most of the day going sideways. While the bulls hope for a series of bull days with higher lows and […]
Emini island bottom and measuring gap for test of 2800
Intraday market update: April 18, 2018
Emini island bottom and measuring gap for test of 2800 I will update again at the end of the day Pre-Open market analysis The Emini gapped up yesterday and created a month-long island bottom. When there is a successful breakout, the Emini often goes sideways for a few days before resuming up. Therefore, a few […]
Emini weak bull breakout of triangle on strong earnings reports
Intraday market update: April 17, 2018
Emini weak bull breakout of triangle on strong earnings reports I will update again at the end of the day Pre-Open market analysis The Emini had a weak bull trend yesterday. However, the rally broke above the top of the 4 week trading range. A weak rally can still lead to a big bull trend […]
Emini had outside down reversal from the 2017 close
Intraday market update: April 16, 2018
Emini had outside down reversal from the 2017 close I will update again at the end of the day Pre-Open market analysis The Emini reversed down on the open on Friday from a breakout above the top of the 3 week range. In addition, it failed to hold above the 2017 close. Both are resistance […]
Emini bulls want measured move up and bears want Leg 1 = Leg 2 down
Emini weekend update: April 14, 2018
Monthly S&P500 Emini futures candlestick chart:Trying to resume up after a 3 month pullback The monthly S&P500 Emini futures candlestick chart so far this month is a bull reversal bar. The odds favor a resumption of the strong bull trend either this month or next. Yet, the 20 month exponential moving average (EMA) is a […]
Emini breakout attempt above triangle as earnings season begins
Intraday market update: April 13, 2018
Emini breakout attempt above triangle as earnings season begins I will update again at the end of the day Pre-Open market analysis The Emini gapped up above Wednesday’s close and rallied yesterday, but then went sideways. The bulls are trying to break above the 3 week trading range. However, the bears are trying to get […]
Emini in breakout mode awaiting Russia’s response to Syrian bombing
Intraday market update: April 12, 2018
Emini in breakout mode awaiting Russia’s response to Syrian bombing I will update again at the end of the day Pre-Open market analysis Yesterday was the second consecutive trading range day and a doji inside day. While it is at the top of a 3 week trading range, it is a weak sell signal bar. […]
