Monthly S&P500 Emini futures candlestick chart:Bulls need follow-through buying The monthly S&P500 Emini futures candlestick chart had a bull bar in May, but a prominent tail on top. It was a breakout above a 3 month bull flag. The monthly S&P500 Emini futures candlestick chart has been sideways for 4 months after a 15 month […]
If you are not seeing the latest Weekly Report below, your PC/device browser is likely showing you an earlier page copy. Simply refresh your browser. For PCs you can use the F5 key, or Ctrl-F5, several times if needed.
Emini breakout soon after Euro sell climax and Treasury bond reversal
Emini pullback in bull trend despite Italy financial crisis
Intraday market update: June 1, 2018
Emini pullback in bull trend despite Italy financial crisis I will update again at the end of the day Pre-Open market analysis After Wednesday’s strong reversal up, yesterday had a weak selloff. It is therefore more likely a pullback from Wednesday’s rally than a bear reversal. Yesterday was the last day of the month. While […]
Emini technical sell climax after Italy and Euro fears
Intraday market update: May 30, 2018
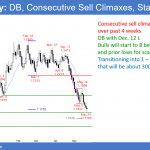
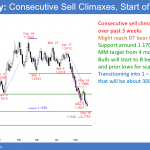
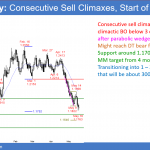
Emini technical sell climax after Italy and Euro fears I will update again at the end of the day Pre-Open market analysis The Emini had a sell climax yesterday, but it was more likely based on technical factors than fundamentals. While it weakens the bull’s case, the odds are that the selloff of the past […]
Emini possible outside down week in 4 month trading range
Intraday market update: May 24, 2018
Emini possible outside down week in 4 month trading range I will update again at the end of the day Pre-Open market analysis While the Emini gapped down yesterday, it reversed up and did not trade below last week’s low. The rally from the May 3 low was strong enough so that there is a […]
Emini bears want outside down candle stick on weekly chart
Intraday market update: May 23, 2018
Emini bears want outside down candle stick on weekly chart I will update again at the end of the day Pre-Open market analysis Yesterday reversed down from a breakout above last week’s high. It sold off strongly at the end of the day and formed an outside down day. Since last week was small, the […]
Emini trend resumption up, but possible small double top
Intraday market update: May 22, 2018
Emini trend resumption up, but possible small double top I will update again at the end of the day Pre-Open market analysis The Emini gapped up yesterday and entered a trading range after a 50% pullback. The odds favor a breakout above last week’s high this week. Because yesterday gapped up and was a small […]
Emini weak breakout above 3 month triangle bull flag
Intraday market update: May 21, 2018
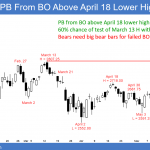
Emini weak breakout above 3 month triangle bull flag I will update again at the end of the day Pre-Open market analysis The Emini broke above the April 18 major lower high, but pulled back. The odds are that the bull trend will resume this week. This means that the 4 sideways days are more […]
Emini weak bull flag after breakout above April high
Emini weekend update: May 19, 2018
Monthly S&P500 Emini futures candlestick chart:Weak buy signal The monthly S&P500 Emini futures candlestick chart traded above the April high. This triggered a buy signal. However, April was a doji bar and therefore a weak signal bar. So far, May is a bull bar, but it is currently only at the April high and not […]
Emini sell signal bar but minor reversal in bull flag
Intraday market update: May 18, 2018
Emini sell signal bar but minor reversal in bull flag I will update again at the end of the day Pre-Open market analysis Yesterday was a bear reversal day. The odds are that the Emini daily chart is still forming a bull flag. However, if the bears get a couple big bear days, the odds […]
Emini weak buy signal yesterday and back above April high
Intraday market update: May 17, 2018
Emini weak buy signal yesterday and back above April high I will update again at the end of the day Pre-Open market analysis The Emini rallied in a trending trading range day yesterday. It was the 2nd day in a bull flag on the daily chart. The odds are that the daily chart will go […]


