I posted this chart after the close. After a bull trend opening reversal at 7:05 am PST, the Emini made a new high, but it formed a parabolic wedge and an expanding triangle top. This resulted in a deep pullback that ended with a parabolic wedge bottom at 10:10 am. It sold off from a […]
Market Update Report for the S&P500 Emini (ES) and Forex (EURUSD) will be available to logged-in Brooks Trading Course members at about 6:20am US Pacific Time each day. The update will be available to everyone, including visitors, about 2 hours after market open.
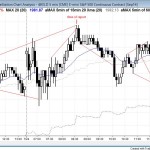
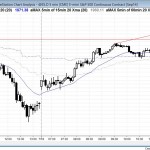
Intraday market update, Wednesday, July 23, 2014: bull trend opening reversal
I posted this chart after the close. The bulls had a bull trend opening reversal at the moving average, but the market then had a parabolic wedge top at 7:45 am. This was followed by a small lower high major trend reversal. It formed as a small double top in a tight trading range, as […]
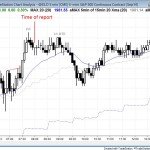
Intraday market update, Tuesday, July 22, 2014: breakout to an all time high
I posted this chart after the close. The Emini and stock market broke to a new all time high, but the breakout and follow-through were weak. The market entered a tight trading range. The bears were able to test the open of the day in the final hour, but the Emini worked back up into […]
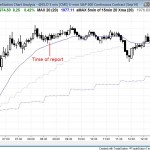
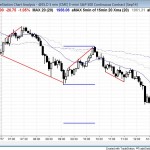
Intraday market update, Monday, July 21, 2014: bear trend reversal
I posted this chart after the close. Today sold off to a parabolic wedge bottom just above yesterday’s low, but the selling lacked consecutive big bear trend bars. This made the selloff more likely a bear leg in a trading range rather than in a bear trend. Also, since yesterday (Friday) was such a strong […]
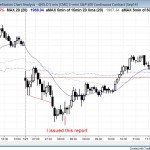
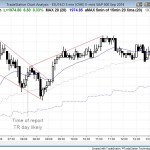
Intraday market update, July 18, 2014: bull trend reversal
I posted this chart after the close. Yesterday had a sell climax in a tight bear channel so the odds favored a rally today that would last at least a couple of hours. The Emini candle chart had a small pullback bull trend day, and it closed near the open of the week, creating a […]
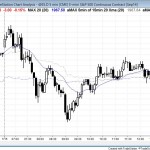
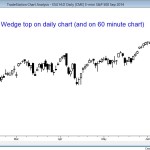
Intraday market update, July 17, 2014: parabolic wedge top
I posted this chart after the close. The market again rallied above last week’s high, but reversed down from a parabolic wedge top. It formed a wedge bottom at the low of the day and held above the most recent 60 minute higher low. After testing the open, it began a small pullback bear channel […]
Intraday market update, July 16, 2014: second failed breakout
I posted this chart after the close. The Emini sold off again from above last week’s high. However, the bear trend on the open looked more like a bear leg in what would probably become a trading range, which was the case. The bulls bought the wedge bull flag for the low of the day, […]
Intraday market update, July 15, 2014: failed weekly buy signal
I posted this chart after the close, showing all of the day’s Emini price action, including the failed weekly buy signal that occurred 20 minutes into the day. The Emini reversed down after triggering a high 1 buy signal on the weekly chart. The wedge bottom at 7:20 am PST failed, and the market fell […]
Intraday market update, July 14, 2014: gap up bull trend
This chart was posted after the close. The Emini and stock market gapped up, but then entered a tight trading range for the rest of the day. The bulls want a breakout above the top of the 60 minute wedge top. The bears want a double top and then a bear breakout below the neckline. […]
Intraday market update, July 11, 2014: last week is a sell signal bar
The Emini was in a triangle for the first three hours of the day and then had a bull breakout. The bulls wanted a second leg up after the strong reversal up yesterday from the failed breakout below last week’s low. Posted 7:41 am PST. The key feature in today’s intraday update is the test […]

