I posted this chart after the close. The Emini reversed down from above yesterday’s high in a big low 2 sell setup (an ABC bear flag). The strong bear breakout at 7:45 led to a bear channel, and the Emini entered a spike and channel bear trend. Bear trends are always forming wedge trend reversal […]
Market Update Report for the S&P500 Emini (ES) and Forex (EURUSD) will be available to logged-in Brooks Trading Course members at about 6:20am US Pacific Time each day. The update will be available to everyone, including visitors, about 2 hours after market open.
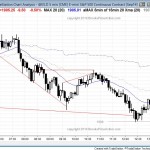
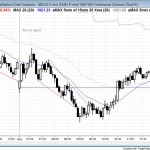
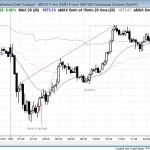
Intraday market update, Wednesday, Aug 6, 2014: bull trend reveral
I posted this chart after the close. The Emini today had a strong bull trend reversal up from below yesterday’s low, and it offered many buy setups for day traders. The Emini and S&P500 had 60 minute lower low major trend reversals. The Emini had consecutive buy climaxes up to the resistance of a measured […]
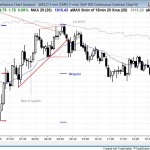
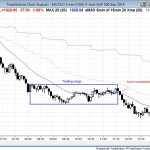
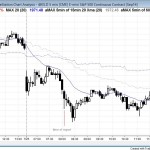
Intraday market update, Tuesday, Aug 5, 2014: opening reversal
I posted this Emini chart after the close. The stock market today remained in a trading range until 10:40 am PST when it had a very big bear breakout bar. Day traders who were watching were able to sell as the bar formed. When a bar is that big, the odds of more selling are […]
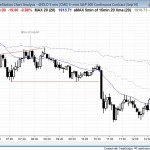
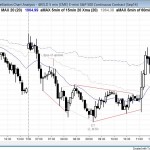
Intraday market update, Monday, Aug 4, 2014: tight trading range
I posted this chart after the close. Today’s Emini price action was controlled by yesterday’s strong reversal up. The odds favored a second leg up. During the first hour of day trading, the stock market was in a tight trading range within yesterday’s trading range. That made a trading range day likely. However, the bulls […]
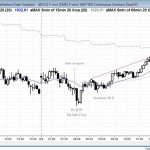
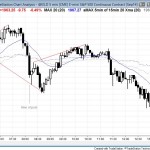
Intraday market update, Friday, Aug 1, 2014: stock market bear trend reversal
I posted this chart after the close. Yesterday formed a huge bear breakout on the daily stock market charts. After an early, big rally today, the Emini fell to a new low of the day. Whenever a rally goes that far above the open, there is a lot of buying pressure, and that reduces the […]
Intraday market update, Thursday, July 31, 2014: gap down and breakout below monthly support
I posted this Emini chart after the close. The Emini gapped down and then entered a trading range from 8:00 am to 11:30 am. This was followed by bear trend resumption into the close. The daily and 60 minute charts are always in short. The breakout was very strong and will probably have at least […]
Intraday market update, Wednesday, July 30, 2014: failed bull breakout on an FOMC report day
I posted this chart after the close. The Emini sold off early and fell below last week’s low and the open of the month. It then reversed up from an expanding triangle bottom, which is always a lower low major trend reversal. There was an 11:00 am FOMC report. The bear breakout below the triangle […]
Intraday market update, Tuesday, July 29, 2014: wedge top bear trend reversal
I posted this chart after the close. The Emini had a wedge top bear trend reversal after yesterday’s final flag. The Emini and S&P500 then reversed up from a wedge bottom. The Emini formed a wedge lower high major trend reversal and then trended down into the close. The overall pattern was very similar to […]
Intraday market update, Monday, July 28, 2014: bull trend reversal
I posted the chart after the close. The Emini sold off and tested last week’s low, and then reversed up from a small wedge bottom. It formed a higher low major trend reversal at 9:45 am, and then rallied to a new high of the day, but failed to get above yesterday’s high. Today bounced […]
Intraday market update, Friday, July 25, 2014: island top in the stock market
The Emini had a wedge bear flag below the moving average on the open, and the opening range was about half of an average day’s range. This is a setup for a measured move up or down and a trending trading range day. The bear breakout below the bottom of the wedge was the entry […]

