Monthly S&P500 Emini futures candlestick chart:
Exhaustion gap
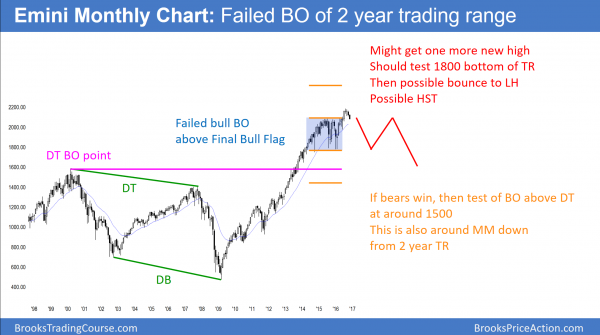
The monthly S&P500 Emini futures candlestick chart finally pulled back below the July 2015 high. The July 2016 breakout is therefore an exhaustion gap.
The monthly S&P500 Emini futures candlestick chart has pulled back for 3 months. I have been writing since the July breakout that the breakout was probably an exhaustion move. When a strong breakout occurs after 20 bars in a trend, it is more likely an exhaustion gap than a measuring gap. The July breakout came after 100 bars in a bull trend. By this week trading below the July 2015 top of the 2 year trading range, the bears closed that gap. Hence, the July 2016 bull breakout is now an exhaustion gap. This therefore meets one of the objectives that I have discussed since July.
Furthermore, there were 7 consecutive bull trend bars on the monthly chart in August. In the 18 years of the Emini, there have never been 8. In addition, every time there has been 7, the Emini corrected about 100 points. This is also a 5% pullback. The Emini met that objective as well this week.
Bull flag more likely than reversal
Because there are other targets below on the daily chart, this pullback will probably fall further. Yet, the 3 bar pullback is still more likely a bull flag on the monthly chart than the start of a bear trend. However, because the 2 year trading range is probably the final bull flag before a 1 – 3 year correction, there will probably be sellers above the old high.
Emini at 1500 in 2 – 3 years
Because of the Final Flag top on the monthly chart, traders will sell any new high. The odds are that the Emini will trade down to the bottom of the Final Bull Flag, even if there is one more new high. Hence, the selloff should reach 1800 within a year or two.
Since the bottom of the 2 year trading range is support and the monthly chart is in a bull trend, bulls will buy there. As a result, there probably will be a rally. That rally will then probably fail around the old high.
If it turns down from a lower high, it would form a lower high major trend reversal. Because there is a Final Flag in 2016, a lower high would be the right shoulder of a Head and Shoulders top. The Final Flag would be the left shoulder.
The monthly chart has been in a bull trend for 7 years. Because that is unusual, it is unsustainable and therefore climactic. Hence, the Emini will probably sell off for at least TBTL Ten Bars, Two Legs.
Ten monthly bars is about a year, but it could be longer. Especially relevant is the double top around 1500. The gap between the current price and those tops probably will close. A correction is often about half as long as the bull trend. Since the bull trend lasted 7 years, the move down might take 3 years. Because Emini corrections are often climactic, the test of 1500 will probably come in less than 3 years.
Weekly S&P500 Emini futures candlestick chart:
Breakout below 4 month trading range
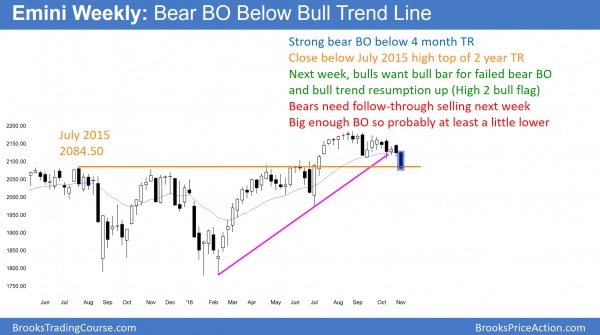
This week, the weekly S&P500 Emini futures candlestick chart had a big bear trend bar. This is a strong breakout below the 4 month trading range. Yet, the bears need follow-through selling next week if this selloff will lead to a reversal.
Measuring gap or exhaustion gap?
The weekly S&P500 Emini futures candlestick chart this week had a big bear bar that closed below the past 16 bars. The bears want a measuring gap. Hence, they need a bear bar again next week as well. If next week is a big bear bar closing on its low, the bears might be able to test the July 1975.00 bottom of the buy climax. That would be below last year’s close. It would therefore turn the Emini negative on the year.
The bulls want next week to have a bull body. They would then see it as a buy signal bar for a failed bear breakout. It would also be a big High 2 bull flag with the September 16 low. In addition, it would be around a 50% pullback of the July rally. This would turn last week’s bear breakout into an exhaustion gap.
Most likely, next week will not be a strong bear trend bar nor a strong bull reversal bar. While the odds are there will be some follow-through selling, this is more likely a Big Up (July), Big Down, Big Confusion pattern. Therefore, the weekly chart will probably go sideways within a week or two. Furthermore, next week will probably disappoint the bulls and bears. Therefore, the Emini might go sideways for 2 – 3 weeks.
Daily S&P500 Emini futures candlestick chart:
Year end rally after presidential election
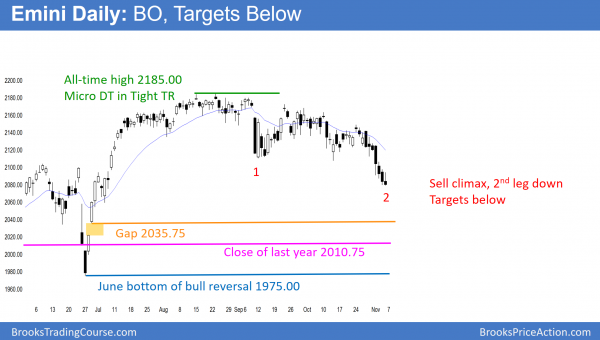
The daily S&P500 Emini futures candlestick chart broke strongly below the September 12 bottom of the 4 month trading range.
The daily S&P500 Emini futures candlestick chart had 7 consecutive bear bars in its break below the 4 month trading range. This is unsustainable and therefore a sell climax. Yet, there is still no bottom.
I have written many times about the August double top in the tight trading range. I posted an example of that type of pattern in my October 5 weekly blog. The title of that blog was, “October 5% correction before presidential election.” While the 5% correction came before the election, it also came 3 days after October.
Sell climax will probably end next week
That article has a 5 minute chart with a double top in a tight trading range. This is comparable to the tight trading range double top in August on the daily chart. I said that this pattern often has 2 legs down. Especially relevant is that the 2nd leg is often a sell climax. In addition, bulls usually buy the sell climax and there is then usually a strong reversal up.
The daily chart is currently in a sell climax. The odds are that there will be a sharp reversal up. Yet, the channel down has been tight. Therefore, there will probably be at least a little more down before the buyers come in. If there is a climactic reversal up, it will probably come within a week or so. Hence, it might come just after the election. A reversal up does not mean a new high, yet it might last until the end of the year.
Support below
Furthermore, I have talked many times about the pullback probably falling to 2040 – 2060. The July 6 low was the 1st pullback after the June bottom. It is therefore a magnet for the bears who held and scaled in during the past 4 months. They will take profits there. In addition, there is a big gap below the June 29 low of 2035.75. Lastly, the Emini might test all of the way down below last year’s close to the June bull trend low. Yet, that is unlikely. However, if the bears hold the market there, the stock market would have a down year.
Traders can see the end of the day bar-by-bar price action report by signing up for free at BrooksPriceAction.com. I talk about the detailed Emini price action real-time throughout the day in the BrooksPriceAction.com trading room. We offer a 2 day free trial.
When I mention time, it is USA Pacific Standard Time (the Emini day session opens at 6:30 am PST, and closes at 1:15 pm PST). You can read background information on the intraday market reports on the Intraday Market Update page.


Hello Al and Trading Course Community!
I cannot seem to get my daily chart to match Al’s. I use Ninja 8.
Are there certain settings for the data series needed?
I thought perhaps it has to do with the rollovers.
I tried different combinations of settings on the data set — using ETH, RTH, and “Use Instrument Setting’s” (also 24/5 and 24/7)
But my chart is slightly (yet irritatingly) different.
Any help greatly appreciated. Thank you
BTW – My chart matches until 9/30, then it drifts away from Al’s chart.
My Weekly is slightly off also…huh?
HI Al
Thanks for this weekly blog. Now that I am a ways into the course it is easier to understand. Though, I do have a question about the trading range imminent conclusion you have regarding the weekly chart. Is that conclusion based on 1) an even distribution of pressure from relatively close prior bars (I assume this) and 2) the fact that when bulls and bars both want a gap then the result is a range for a bit?
Any insight would be appreciated.
Thanks.
Whenever a market has a big move up or down, and then an opposite big move, confusion is more likely than a new trend. The weekly chart was strongly up in July, and then strongly down last week. This results in confusion. When there is confusion, traders do not believe the market is going far up or down. That leaves sideways.
I am writing this after Monday’s strong reversal up. There will probably be some follow-through buying tomorrow. Yet, the Emini is back at a price where it went sideways for 2 months. This also increases the chances of some sideways trading. However, the reversal up was strong enough so that it will probably work up to the top of the September/October range.
Hi Al,
Can I ask you a loaded question? Something my brother-in-law Ed (who is a well known economist at Duke with over 40 years of market experience), but also Jim Cloonan of AAII bring up with respect to technical analysis. Jim contends there is no verifiable evidence that a portfolio purely driven by technical analysis over a 10 – 20 year time horizon can beat the market return.
You mentioned Paul Rotter as a long-term success story. Maybe he, and a few others, are exceptions. But when you check out Rotter’s Swiss-based company Rotter Invest AG all you find is hype. And apparently his company went bust in July of this year. Even respected organizations like GS and JPM do not disclose their long-term performance in a way that is academically verifiable over 20 or 30 years.
It seems as you said in your book: those to know don’t talk, and those who talk don’t know.
It’s not a loaded question. I spent 7 years at the University of Chicago Medical Center at a time when their economists said the same thing. Furthermore, they had more Nobel Prize winning economists than any other university on the planet. Yet, years later, many in the business school began to teach the importance of technical trading.
My belief is that old school economists feel that they own the markets and they resent self-taught upstarts (technical traders) who trade better than they do. Since they are the establishment and have the microphone, they get the press. I also believe that their studies are designed to prove their belief and not find the truth. I have known many traders over the years who have done extremely well long-term trading purely technically, and far better than the overall market.
We each get to believe what we want. If your brother-in-law saw a trader making many hundreds per cent a year as a technical trader, I assume he would dismiss him as an outlier, and claim that he will eventually burn out. When a person has a religious belief, it is very difficult to persuade him that your different religious belief is also valid. He doesn’t believe that a technician can be smarter than him. I don’t believe that his studies are correctly designed.
When a successful technical trader begins trading a certain size, he has to change his trading style. While Rotter made a fortune trading a $10 million account by scalping 3 pips on 5 – 10 million units per trade, I would be surprised if he could do that while trying to trade 100 million units. Look at Tutor Jones. He was making more than 100% per year initially. When his fund grew to $100 million, he made about 30%. Now that he trades billions, he makes the same as everyone else. Why? When he was trading $20 million, he had no problem scalping 100 Emini contracts. However, if he now has to trade 3,000 Emini contracts, he can no longer trade the same way.
One final thought is that many fundamental institutions will try to buy a 5% or a 10% pullback, or a pullback to support. That is technical trading. Because that improves their performance and those studies have them classified as fundamental firms, some of the fundamental profit comes from technical trading. If the studies backed that out and looked only at returns from fundamental trades, those firms would have a worse performance. I could talk about many other reasons for Ed’s flawed reasoning, but this gives you an idea of my thoughts.
By the way, I have 2 sisters and a brother, all with PhDs and all are university professors. It is really enlightening to speak with them. For example, my brother basically believes that anyone who does not agree with him on any issue cannot have a high IQ. Yet, many of his opinions are crazy. I guess I have a low IQ.
Thanks for your reply – I do take your word for it :)!
We often have “heated” discussions about the various forms of efficient market hypothesis and capital asset pricing models, but also how theoretical models may be flawed. As an engineer I can relate to model limitations. I guess an economist tends to follow Einstein’s advice: “…if the facts don’t fit the theory, change the facts.”
Been trading full time in the e-mini for two years without much of a clue. I get to understand it much better now. Knowing the market cycles, its transitions, in which one we are now, and that there is a diferent approach for each one has been a revelation to me. Thanks.
Al,
Thank you for your commentary.
Hi Al would it also be possible for you to review the Nifty Index chart that trades in India ?
I would love to review that occasionally, as well as China and Europe, but I do not have the data.
Thank you Al. The charts are available here on a free site called stock charts. Link below.
http://stockcharts.com/freecharts/gallery.html?$NIFTY
I told Richard that I am interested in doing this late in the winter. I want to finish the course update, and I have to work on talks for Las Vegas in 2 weeks, and then 2 webinars for Futures.io (Big Mike) in December and February. Plus, I’m an old guy, and I need some down time.