Monthly S&P500 Emini futures candlestick chart:
Trump, North Korea, and Syria catalysts for 5 percent correction
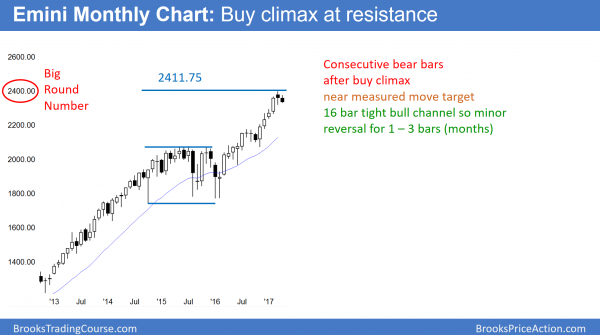
The monthly S&P500 Emini futures candlestick chart has a bear inside bar so far this month. It is stalling at a measured move up from the 2 year trading range.
The monthly chart has been in a strong bull trend for 8 years. While there is no top yet, the 2014 – 2015 trading range will probably be the final bull flag. Consequently, the rally will probably not continue much higher before there is a reversal down to the bottom of that final flag. Hence, 1800 is a target for the bears at some point in the next couple of years.
The monthly S&P500 Emini futures candlestick chart has stalled for 2 months after a 4 month buy climax. Since the buy climax was a test of the measured move projection based on the 2 year trading range, this rally might be simply a buy vacuum test of resistance. Consequently, it has an increased chance of being an exhaustive end of the 8 year bull trend.
While it is possible the it is a breakout into a new, stronger bull trend, this is less likely after an 8 year bull trend. Hence, the gap between this month’s low and the August high is more likely an exhaustion gap than a measuring gap.
Buy climax, but bull flag likely
A climax at resistance is usually not enough to reverse a bull trend into a bear trend. Since this 16 month rally is in a tight bull channel, bulls have been willing to buy at the high of every bar. Hence, if the Emini trades below the low of the prior month, many bulls will see the reversal as an opportunity to buy at a discount. Therefore, bulls will buy the 1st reversal down. It will consequently likely become a bull flag and not a bear trend.
A micro double top can lead to a major reversal
If the bull trend resumes after a 1 – 3 month pullback, the bears will be more willing to sell. This is because they then would have a micro double top at major resistance. They therefore would have a higher probability of creating a major reversal.
A micro double top on the monthly chart is a double top major trend reversal on the daily chart. Since this would have a 40% chance of a swing down, the bears would have a reasonable chance of a test of the 1800 bottom of the 2 year final bull flag.
Weekly S&P500 Emini futures candlestick chart:
Price and time buy climaxes
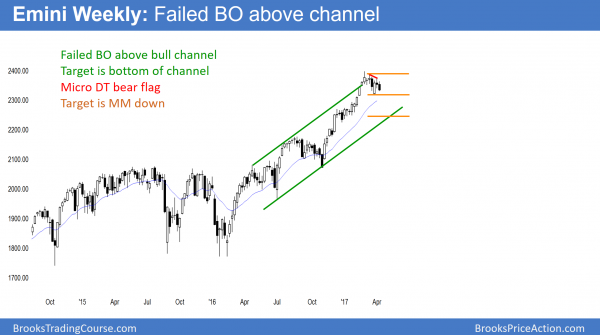
The weekly S&P500 Emini futures candlestick chart is far above its moving average. Furthermore, it has not tested the average in 22 weeks. In addition, it is reversing down from a breakout above its bull channel. This week is the entry bar for a micro double top lower high. Since this week was not a big bear trend bar, is was not a strong entry bar. The odds therefore favor more bars in the tight trading range.
The weekly S&P500 Emini futures chart rallied to far above the weekly moving average. This extreme behavior is a buy climax based on price. I discussed last week that the past 22 weeks have not touched the moving average. I also provided a chart. Since that is unsustainable, it, too, is climactic. Yet, it is a climax based on time. With buy climaxes based both on price and time, there is an increased chance of a pullback.
The first target is the weekly moving average. Since this reversal down is coming after a failed breakout above the 16 month weekly bull channel, another target is the bottom of the channel. Finally, the Emini has not tested the close of last year. Hence, that is also a target. As a result of the climaxes and targets, the Emini will probably pull back at least 5% over the next couple of months.
Daily S&P500 Emini futures candlestick chart:
Bull flag, but more likely early bear trend
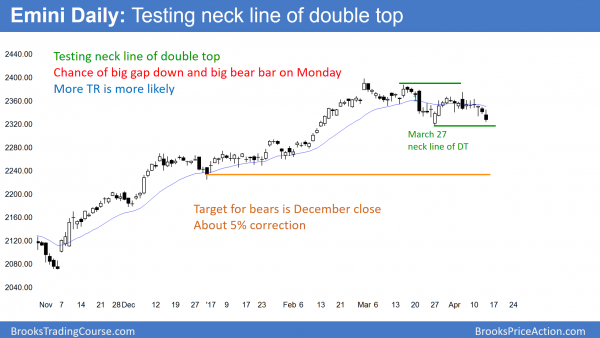
The daily S&P500 Emini futures candlestick chart has been in a trading range for 2 months. Until it breaks strongly below the March 27 low or above the March 15 high, most legs will continue to reverse.
The daily S&P500 Emini futures candlestick chart has been in a bull trend for 16 months. The bulls correctly see the 2 month trading range as a bull flag. Yet, the weekly chart is probably in control. That chart is likely to correct 5% over the next couple of months. Therefore the weak bear channel on the daily chart that began at the all-time high will probably accelerate below the March 27 low within the next month or two.
As a result, that breakout will probably lead to a measured move down from the double top. Hence, the selloff will probably reach the targets below on the weekly chart.
Because of Friday’s bear close, there is an increased chance of a gap down on Monday. If there is a big gap down below the March 27 low and a big bear trend day, traders will conclude that the Emini will fall for a measured move.
This has about a 30% chance of happening. More likely, the trading range will continue. Consequently, the odds are that the Emini will reverse up over the next week or two, even though it will probably break strongly below the March 27 low at some point in the next couple of months.
Wedge bull flag on 60 minute chart
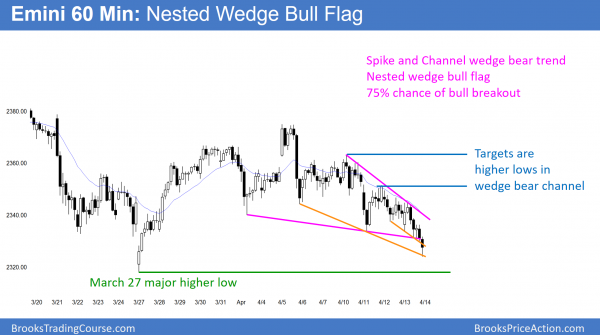
The 60 minute chart has a nested wedge bear channel. Since it is above the March 27 bottom of the bull trend, it is a wedge bull flag. It is also a spike and channel bear trend.
The bulls rallied from the March 27 High 2 bull flag on the daily chart. Yet, it has sold off since April 5. Because the selloff is still above the bottom of the bull reversal, the bulls see the selloff as a bull flag.
The daily chart had strong pushes down on April 5 and 11. On the 60 minute chart, April 5 is a strong bear breakout. Furthermore, the 60 minute chart has been in a bear spike and channel since then. Yet, it is still above the March 27 bottom of the bull trend. Consequently, the bulls see the selloff as a potential wedge bull flag. When a pattern is nested like the wedge on the 60 minute chart, the odds are higher that it will perform as expected. Hence, the odds of a bull breakout are higher than with other wedge bottoms.
While there are 3 legs down and a clear wedge on the 60 minute chart, there have only been 2 legs down on the daily chart. Furthermore, there is still room the the March 27 low. Some bulls will therefore wait for 1 more leg down next week before they will buy. In addition, legs in a trading range often fall below major support before reversing up. Hence, the bulls might not buy until after a dip below the March 27 low. If the bulls get their reversal up, they will want the rally to test the March 15 major lower high. The first targets in a wedge bottom reversal are the lower highs in the wedge bear channel.
Wedge bottoms usually have bull breakouts
In general, a wedge bottom has a 25% chance of a bear breakout and a measured move down. It therefore has a 75% chance of a bull breakout and then either a trading range or a reversal up. However, this depends on context. Since the weekly chart probably is in a pullback, the daily chart is therefore probably in an early bear trend. Hence, the probability of a bear breakout below the wedge bottom is higher. Yet, it is still probably not more than 40%.
Consequently, the odds are that the Emini will rally over the next few days even if it sells down to the March 27 low 1st. Yet, there is still a 60% chance that one of these selloffs will strongly break below the March 27 low at some point in the next month or so. Betting that any one will succeed is a low probability bet. This is because most trading range breakouts fail, even though one eventually succeeds.
Weekly reversal
Since the weekly chart is bearish, the odds are that a rally to the March 15 high will fail. Hence, the bears would then sell a reversal down from the double top. Alternatively, the rally could fail at a lower high. The bears would sell that reversal down as well. This is because they would see it as just another lower high in an early bear trend.
Traders can see the end of the day bar-by-bar price action report by signing up for free at BrooksPriceAction.com. I talk about the detailed Emini price action real-time throughout the day in the BrooksPriceAction.com trading room. We offer a 2 day free trial.
When I mention time, it is USA Pacific Standard Time (the Emini day session opens at 6:30 am PST, and closes at 1:15 pm PST). You can read background information on the intraday market reports on the Intraday Market Update page.


Hi Al,
In your course in 1st video of Support Resistance you mentioned showed wedge bottom for the Yen monthly chart
You quoted a figure of 75% probability of a bull breakout.
Have you ever printed off a % probability legend that corresponds to your different patterns ?
It would be very helpful to have this information coming from yourself.
Thank you
I missed to include that you were referring to the descending wedge bottm pattern MTR
Looks like a failed H2 on the weekly chart after this week fell below last week.
Yes, that is why there is a micro double top.
I am excited to know that my analisys of the wedge bottom in the 60 minutes chart and its probable reversal up matched with yours. Now I can see that I am learning from you Mr Brooks. I hope my P/L start improving soon. I ve been trading (losing) for almost three years and my main problem are my early exits.
For the bull swing traders, they need either a good buy signal bar or a strong reversal up. As long as their premise is still valid, they will hold at least part of their position for a test of either of the lower highs in the wedge. Additionally, they want the rally to have at least 2 legs. Furthermore, they expect it to last about half as many bars as there were in the wedge bear channel as another minimum. Finally, their absolute minimum goal is 2 times actual risk. Yet, that is rarely the best decision. Two times initial risk is a better minimum, but the other targets are better.