Monthly S&P500 Emini futures candlestick chart: Might trigger sell signal
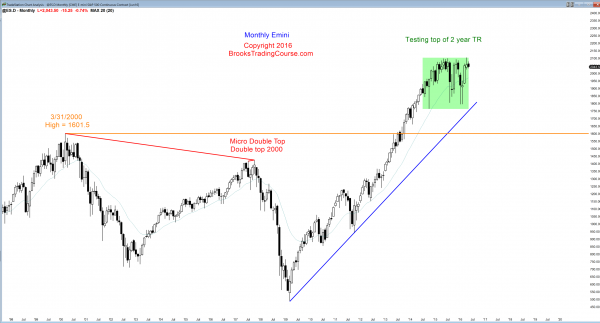
The monthly S&P500 Emini futures candlestick chart is moving down and it might fall below last month’s low. This would trigger a sell signal for a failed breakout above a 2 year trading range.
The monthly S&P500 Emini futures candlestick chart still has not triggered the short by falling below last month’s low. Many bulls are hesitant to buy until they see how aggressively the bears will sell below that sell signal bar. Since April had a bull body and it followed 2 strong months up, the odds are that there are buyers below the April low. However, traders want to know, and they only way that they find out is if May trades below the April 2026.00 low. The odds are that it will happen this month.
Weekly S&P500 Emini futures candlestick chart: 3 week trading range after bull micro channel
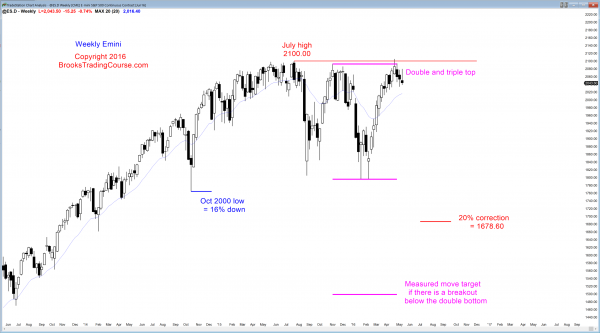
The weekly S&P500 Emini futures candlestick chart has had 3 consecutive bear bars after its 11 week bull micro channel. It might have to pull back to the moving average before the bulls will return.
The weekly S&P500 Emini futures candlestick chart had an 11 bar bull micro channel, which is unusual and therefore climactic. When the Emini traded below the low of the prior week, it created a pullback. That signaled the end of the bull micro channel. When a micro channel lasts about 10 bars, the 1st bear breakout is usually limited to 1 – 3 bars. This week was the 3rd bar. Even if it falls several more weeks, the rally was so strong that the best that the bears can probably get is a trading range and not a bear trend.
Once the pullback ends, the Emini usually tests the top of the bull micro channel, which is the April all-time high. Whether or not it reaches a new high, the Emini then usually enters a trading range. It already has been in a trading range for about 7 weeks, and the trading range would just get a little taller if the Emini turns down from a new high.
After the Emini has been in a trading range for 10 or more bars, it then can begin to create a top (like a double top) with a reasonable chance of having a swing down. Traders will look at reversals down at that point more seriously because they would then have a reasonably chance of beginning a swing down.
Daily S&P500 Emini futures candlestick chart: Learn how to trade a trend reversal candlestick pattern
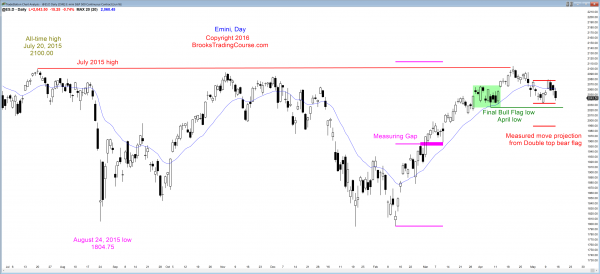
The daily S&P500 Emini futures candlestick chart is turning down from a double top bear flag. The measured move projection is around 1990.
The daily S&P500 Emini futures candlestick chart is back in the April Final Bull Flag. When there is a reversal from a Final Flag, the selling usually extends to at least a little below the flag. That low is the April 7 low, which is the low of April. If the Emini falls below it, it would trigger a sell signal on the monthly chart.
The daily chart has been in a trading range for 2 months and it is near the bottom. Most trading range breakouts fail. Every trading range always has a valid buy setup and a valid sell setup. The bulls want a double bottom with last week’s low. The bears want a breakout below that low, which is the neck line for a 2 week double top bear flag. A double top bear flag is more likely to reach a measured move target if the selloff before it was strong. The selloff from the April high has lacked big consecutive bear trend bars. It therefore was not a strong bear trend. Most breakouts fail. If the Emini falls below the neck line or below the April low, the breakout will probably not fall far before the bulls reverse the Emini back up. However, the bigger the breakout, the more likely it will reach the measured move target. It could then fall to lower support levels like the March measuring gap, which is a 50% pullback of the rally from the February low.
Since the reversal down this week only followed 3 bars up, it is a minor reversal. A major trend reversal usually is a bigger pattern with at least 5 – 10 bars in the rally to the lower high. This means that the selloff of the past 3 days will probably be part of a trading range. It also increases the chances that a breakout below the April low will be bought, and a trading range would then unfold. This is consistent with the weekly and monthly charts, which are more likely to go sideways than very far down.
Whenever something is much more likely than not, traders always have to pay more attention to the “not.” This is a setup for a Pain Trade, which is a low probability trade that many traders deny can happen, even as it is happening. They keep betting on reversals, and the Pain Trade ends up lasting much longer than they think is possible. Here, the Pain Trade would be a successful bear breakout in the face of good arguments based on the weekly and monthly charts that make a bear breakout unlikely. Also, the lower high major trend reversal on the daily chart does not have enough bars to be a major reversal, so a major reversal is unlikely.
This Pain Trade possibility means that Monday might even gap down and quickly fall below the April low, and fall much further than traders believe is realistic. Price is truth. If that happens, instead of denying it and looking for buy setups, trade stupid. Stop thinking so much. Don’t question it, only sell, and calmly say to yourself, “Well, look at that. It should rally, but it is going down. I’m going to just sell.”
What is most likely to happen next week? The Emini is at the bottom of a 2 month trading range. Most breakout attempts fail. The odds are that this one will fail and lead to a reversal up either next week or the week after. There is no sign of a bottom yet, but there probably will be at least a bounce early next week, and the 2 month trading range will then add more bars, as trading ranges typically do. There is always eventually a successful breakout, but traders know that they make more money buying low, selling high and scalping until they see a clear breakout.
Traders can see the end of the day bar-by-bar price action report by signing up for free at BrooksPriceAction.com. I talk about the detailed Emini price action real-time throughout the day in the BrooksPriceAction.com trading room, and a 2 day free trial is available.
When I mention time, it is USA Pacific Standard Time (the Emini day session opens at 6:30 am PST, and closes at 1:15 pm PST). You can read background information on the intraday market reports on the Intraday Market Update page.


I am just getting around to read this on Monday evening. Such a fine piece of detailed analysis. I can imagine years of hard-earned wisdom in the last few paragraphs … the low probability occurrence, referred to as the “pain trade”. Your advice is priceless … “Price is truth. If that happens ….” and I have saved this gem to reference in the future, when I am in denial. Thanks for all the effort you put into mentoring traders. Great to see you are doing better with your health! God Bless You, Al!