Monthly S&P500 Emini futures candlestick chart:
Strong breakout, but possible stock market August correction
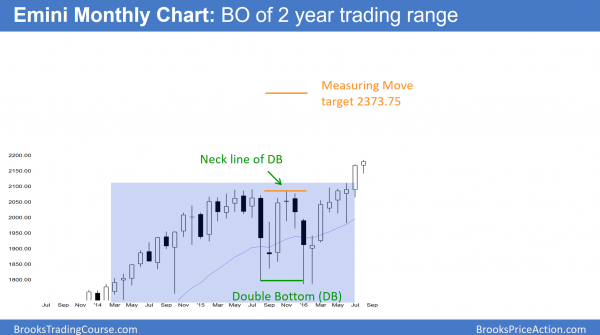
The monthly S&P500 Emini futures candlestick chart has 7 consecutive bull trend bars. This is unusual on the monthly chart so the odds are that August will close below its open. It is too early to know if the rally will eventually reach the Measured Move target. The 2 year trading range late in the bull trend is probably the Final Bull Flag. Traders should be ready for a possible stock market August correction.
The monthly S&P500 Emini futures candlestick chart has had 6 consecutive bull trend bars. Because this is unusual on the monthly chart, it is unsustainable. Therefore, it is a buy climax. Hence, the odds are that August will have a bear body, which means a close below the open of the month. If August is a bear trend bar, it would be a sell signal bar in September. However, after 6 consecutive bull trend bars, the odds are that there would be buyers below the August low. Hence, the best the bears will probably get is a pullback in a bull breakout.
The bears want the 2 year trading range to be the Final Bull Flag. While it probably will be, the odds are that they will need at least a Micro Double Top before they will be able to create a reversal. Furthermore, the rally may reach 2400 before the final top is in. That is a Measured Move up based on the 300 point height of the 2 year trading range.
Weekly S&P500 Emini futures candlestick chart:
Strong breakout but losing momentum
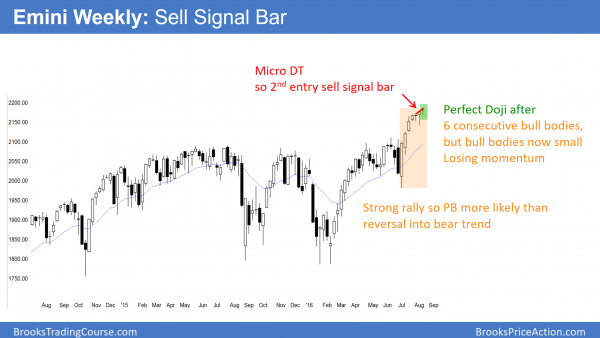
The weekly S&P500 Emini futures candlestick chart has rallied for 7 weeks, but the last 4 have had small bodies. The rally is losing momentum. Yet, there is no sign of a top.
The weekly S&P500 Emini futures candlestick chart has been rallying for 7 weeks. Yet, the past 4 weeks have had small bodies, which is a sign of a loss of momentum. Furthermore, the 1st 6 weeks had bull bodies. That is extreme behavior and it is therefore climactic. Because the Emini broke above a 2 year trading range last month, traders are wondering if the breakout will fail.
This past week is the 2nd sell signal bar since the breakout, and 2nd signals have a higher probability of success. As a result, bears will be more willing next week to sell if next week trades below this past week’s low. Furthermore, bulls will be more eager to exit. They see the past 4 weeks as disappointing. Hence, the odds of a failed breakout are higher.
While the rally can continue indefinitely, the loss of momentum and the absence of bears bars make a pullback likely soon.
Daily S&P500 Emini futures candlestick chart:
Nested Final Flags on 5 time frames, but targets above
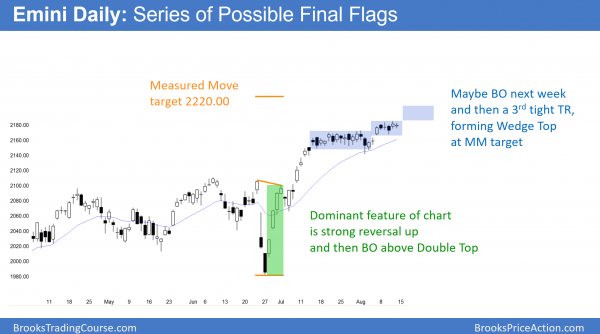
The daily S&P500 Emini futures candlestick chart has measured move targets around the big 2200 round number. While there are nested Final Flag Tops on 5 time frames, the odds still favor a little more up before a reversal down.
The daily S&P500 Emini futures candlestick chart The Emini daily chart has been in a tight trading range for 6 days. There is an adage on Wall St. that says, “A small trading range above a bigger trading range will reverse back down.” While most sayings are not reliable, this one is interesting because it is consistent with what I have been saying about the nested Final Flag Tops.
The monthly chart was in a 2 year trading range. It broke to the downside and then reversed up strongly in January and made a new high. The weekly chart was in a trading range for several months and broke to the downside in February. It, too, reversed up strongly to a new high. Finally, the daily chart was in a trading range in July. After a bear breakout, it reversed up to a new high.
Nested tops now also on 60 minute
Most noteworthy is that the nested Final Bull Flags is now extending down to the 60 minute and 5 minute charts. They are also Expanding Triangle Tops, but because the shape is not good, I am referring to them as Final Flags. The daily chart has been in a 6 day tight trading range. The 1st 4 days formed a tight trading range on the 60 minute chart. The bears got a bear breakout, but the bulls bought it and the Emini rallied to a new high. The 5 minute chart was in a tight trading range on Thursday. Friday broke below it. If there is one more new high, then the same Final Flag Topping pattern will be on the monthly, weekly, daily, 60 minute, and 5 minute charts. It might even form on the 1 minute chart on Monday.
Is the top in?
The daily chart still has Measured Move targets around 2,200 and 2,220. Furthermore, the momentum up is good enough to get there. The odds favor a test of the resistance levels above. Yet, the bull trend is old and weakening, there is an unusual nested top on 5 time frames, and August often has strong pullbacks. Therefore, the odds also favor a 50 – 100 point selloff within the next several weeks, whether or not there is a test of 2,220 first.
Because there are obvious resistance targets above, there is a risk of a Buy Vacuum test of those levels. Support and resistance are magnets. Hence, when the market gets close, it often accelerates to the magnet. Once there, the magnetism often suddenly disappears.
Possible Buy Climax soon
If traders become very confident of reaching the targets, bulls buy aggressively. Sellers stop selling because they know they soon will be able to sell at a higher price. As a result, the market can accelerate dramatically to the targets. Furthermore, it often overshoots the resistance. However, the bulls take profits at the targets. Additionally, the market is then exactly where the strong bears want it be. With bulls selling to take profits and bears shorting, the market can reverse down sharply and for a long time. In conclusion, traders should not be surprised if there is a climactic top soon.
Traders can see the end of the day bar-by-bar price action report by signing up for free at BrooksPriceAction.com. I talk about the detailed Emini price action real-time throughout the day in the BrooksPriceAction.com trading room. We offer a 2 day free trial.
When I mention time, it is USA Pacific Standard Time (the Emini day session opens at 6:30 am PST, and closes at 1:15 pm PST). You can read background information on the intraday market reports on the Intraday Market Update page.


Thank you Al for the very instructive commentary.
Excellent Analysis Al.