Monthly S&P500 Emini futures candlestick chart:
Hesitation at the all-time high
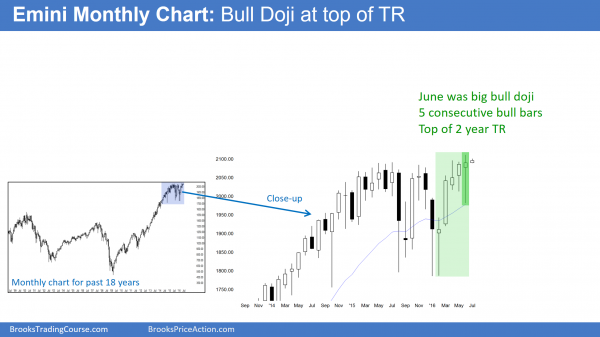
The monthly S&P500 Emini futures candlestick chart had a doji candlestick pattern in June after 2 small sideways months. Although there have been 5 consecutive bull months, the bears have been able to prevent a strong breakout.
The monthly S&P500 Emini futures candlestick chart started a new month on Friday. June ended on Thursday and it was an outside month, trading both above and then below May’s range. Yet, it only had a doji body. This is bullish, but the Emini is also at the top of its 2 year range. Hence, despite 5 consecutive months with bull bodies, the bulls have not yet been strong enough to get a strong breakout.
The cash index is 32 points below its all-time high from July 2015. The momentum up is strong so it will probably get close to its all-time high. As a result, the Emini will also rally. The Emini is only 14 points below its all-time high, which formed last month. Consequently, if the cash index gets very close to its all-time high, the Emini will make a new all-time high. This is likely this summer. Yet, most breakouts fail so there is only a 40% chance that the breakout will go far before the Emini reverses back into the range.
Weekly S&P500 Emini futures candlestick chart:
Strong bull reversal, but still within trading range
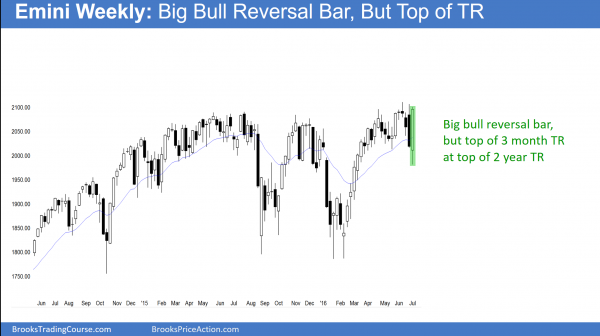
The weekly S&P500 Emini futures candlestick chart had a huge bull reversal bar last week. However, it is within a 3 month tight trading range. This context makes more sideways trading likely.
The weekly S&P500 Emini futures candlestick chart created a huge bull reversal bar during the past week. However, the Emini is just below the top of its 3 year range. Buying at the top of a trading range is a low probability way to trade. As a result of the past week being a big bar, bulls who buy above it next week have a lot of risk. They will put their stop below last week’s low.
Think about this. Stop entry bulls have low probability and big risk. That means that buying on a stop above last week’s high will probably result in a loss. Consequently, limit order bears who sell above last week’s high and manage their trades well will probably make money.
Context
This is a good example of the importance of context. Here, there is a good buy candlestick pattern. Yet, the bar is forcing traders to take a low probability buy that has big risk. The big risk is due to the bars to the left, which is what I mean by context. Especially relevant here is that traders need context in addition to a candlestick pattern.
Can the buy above last week’s high be profitable? Of course, but that does not mean it is a profitable strategy. While a trade can be profitable, traders need to know if they will make money taking a similar trade 10 – 20 times. That is the problem here. More likely, next week will be sideways whether or not it triggers the buy signal by going above last week’s high.
Daily S&P500 Emini futures candlestick chart:
Reversal Emini candlestick pattern
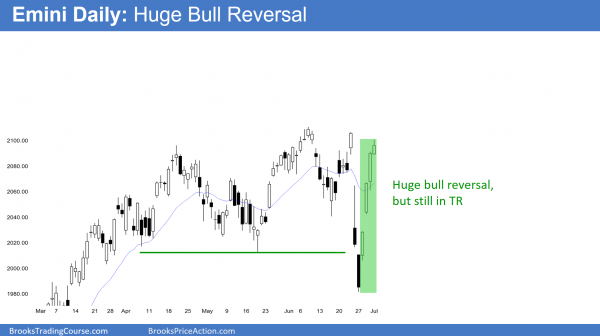
The daily S&P500 Emini futures candlestick chart had 3 big bull trend bars this past week. Friday was a fourth, but less strong. The rally totally reversed the prior week’s selling. A Big Down, Big Up candlestick pattern usually leads to a trading range for at least a few bars.
The daily S&P500 Emini futures candlestick chart had 3 big bull trend days this past week. Friday was a smaller bar that did not close on its high. The selloff and rally of the past 2 weeks is a Big Down, Big Up candlestick pattern. As a result, traders are confused. Consequently, they are quick to take profits. If neither bulls nor bears will hold onto positions, the legs up and down will be small. Hence, a trading range begins to form. This is likely next week.
Last week of June usually bullish
I mentioned last week that the final week of June until July 5 is one of the most reliably bullish times of the year. This past week was exceptional. By inference, you can correctly conclude that the bullishness ends around July 5. When a market is bullish and then it is not, it probably is then in a trading range. This is especially likely after such a strong rally.
While it is possible that this coming week will be comparably strongly bulls and break out strongly, the odds are against it. The stop for the bulls is below last week’s low. That is far. When the risk is big, bulls have to reduce risk. The 1st thing that they do is reduce the size of their position. Consequently, a their selling some of their longs creates a pullback. That is likely what traders will see for several days next week.
Traders can see the end of the day bar-by-bar price action report by signing up for free at BrooksPriceAction.com. I talk about the detailed Emini price action real-time throughout the day in the BrooksPriceAction.com trading room, and a 2 day free trial is available.
When I mention time, it is USA Pacific Standard Time (the Emini day session opens at 6:30 am PST, and closes at 1:15 pm PST). You can read background information on the intraday market reports on the Intraday Market Update page.


Thank you for your commentary.