Monthly S&P500 Emini futures candlestick chart:
President Trump’s all-time high bull breakout
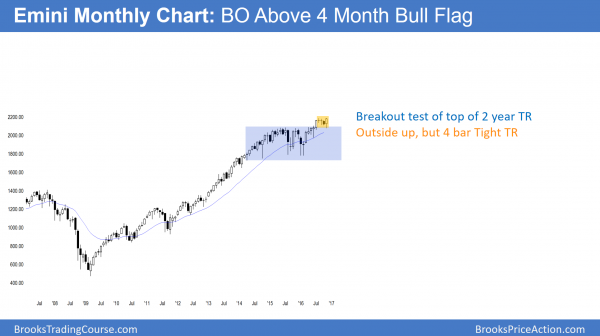
The monthly S&P500 Emini futures candlestick chart formed an outside bar this month after a 4 month pullback from a new high.
The monthly S&P500 Emini futures candlestick chart currently has an outside up month. The bulls want the month to close above last month’s high. This would therefore be an additional sign of strength.
The 4 month pullback from the August high was a bull flag. The odds therefore favor at least a little more up. Yet, the monthly chart is in a 4 month tight trading range. This limits the chances for a big bull breakout. Furthermore, it increases the chances that the Emini will be mostly sideways for at least one more month.
What do the bears need for a monthly sell signal?
If December is an inside bar, it would create an ioi Breakout Mode setup. If it is a bull bar, the bulls would be more inclined to buy above December’s high. Hence, they would be looking for at least one more month up.
Yet, the bears want December to be reversal bar. If December trades above November, the bears will try to create a bear reversal bar. If December is an inside bar, the bears will try to make it close on its low. In the absence of a strong sell signal bar, most bear will not sell on a stop below December’s low.
Weekly S&P500 Emini futures candlestick chart:
Follow-through buying after last week’s breakout
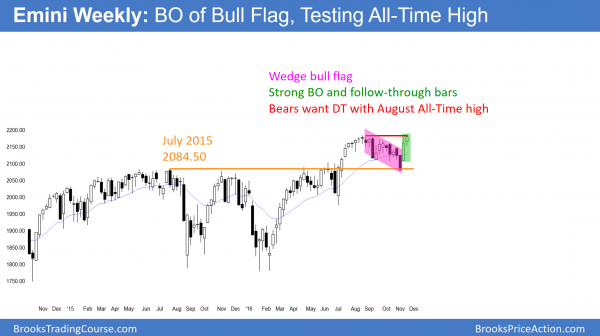
The weekly S&P500 Emini futures candlestick chart had a bull body this week. Bulls therefore see this week as an acceptable follow-through bar.
The weekly S&P500 Emini futures candlestick chart this week had a bull body. While the bar was not a strong bull trend bar, the bull body increases the chances of higher prices over the next couple of weeks. The odds would have been better if this week was a big bull trend bar.
Yet, it is still possible for next week to reverse this week. The bears want to create a big bear trend bar next week. Furthermore, they want it to close on its low and at or below this week’s low. They would then increase the chance of a higher high major trend reversal on the weekly chart.
Because last week was such a big bull bar and this week was a consecutive bull bar, the Emini will probably go at least a little higher. This is true even if next week is a bear sell signal bar. If it is, there will probably be more buyers than sellers below its low.
Daily S&P500 Emini futures candlestick chart:
Presidential election stock market rally is stalling
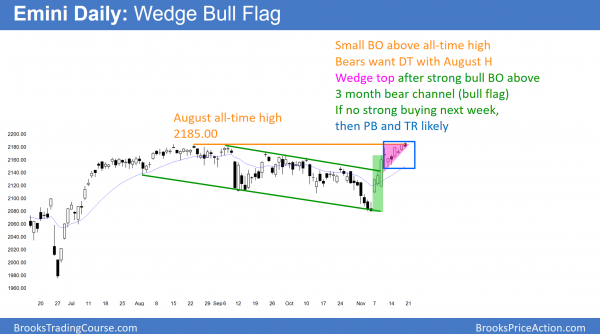
The daily S&P500 Emini futures candlestick chart made a new all-time high this week. Additionally, it is in an 8 bar bull micro channel. Yet, the bears see the rally was an 8 day wedge.
The daily S&P500 Emini futures candlestick chart broke to a new high and has an 8 day bull micro channel. While the 8 day channel has lacked big consecutive bull bars, it was strong enough so that bulls will buy the 1st reversal down.
Because the 8 day rally had 3 pushes up, it is a wedge top. Yet, when a wedge top is also a tight bull channel, it usually is a minor top. As a result, bulls will buy the reversal down. Furthermore, bears will be hesitant to sell below bars until after at least a couple big bear days. Therefore, while the rally will probably pull back next week, the pullback will likely create a bull flag. Hence, the odds still favor higher prices, even if a couple small legs down follow the small wedge top.
Traders can see the end of the day bar-by-bar price action report by signing up for free at BrooksPriceAction.com. I talk about the detailed Emini price action real-time throughout the day in the BrooksPriceAction.com trading room. We offer a 2 day free trial.
When I mention time, it is USA Pacific Standard Time (the Emini day session opens at 6:30 am PST, and closes at 1:15 pm PST). You can read background information on the intraday market reports on the Intraday Market Update page.


Al,
Thank you for the commentary.