Monthly S&P500 Emini futures candlestick chart:
Outside up month
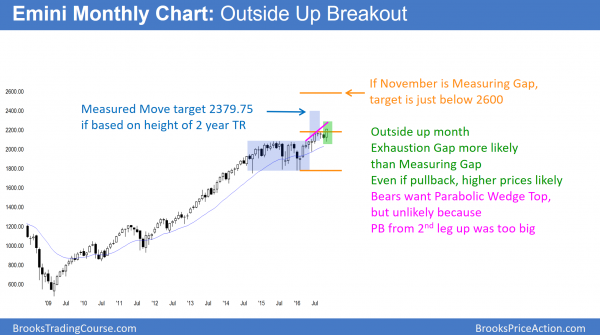
The monthly S&P500 Emini futures candlestick chart has an outside up month in November. The bulls want it to be a Measuring Gap, while the bears hope it will be an Exhaustion Gap.
The monthly S&P500 Emini futures candlestick chart traded below October’s low and above its high. November is therefore an outside month. If the Emini is on its high when the month closes on Wednesday, it would be a sign of especially eager buying. It would therefore make higher prices likely. The bulls are hoping for a measured move up after the 2 year trading range. The target is around 2380.
Because this big bull outside bar is in a 4 bar tight trading range, there is an increased chance that the bulls will be disappointed once the month closes. Hence, there might be a tail on the top of the bar. This would therefore be a sign that bulls took some profits. They therefore would be less confident of higher prices.
Measuring Gap or Exhaustion Gap?
Since traders correctly believed that the rally from February might reverse down after breaking above the 2 year trading range, there is an increased chance that November will be a Measuring Gap. Whenever there is a surprise bar, like Novmeber, the odds favor follow-through buying. Because November is breaking above a possible top, it could lead to a Measured Move up from the February low. While that is unlikely after a bull trend has lasted 100 bars as this one has, that Measured Move target is just below 2600.
When a bull breakout comes late in a bull trend, it is more likely an Exhaustion Gap than a Measuring Gap. Exhaustion usually does not mean trend reversal. More often, it means that the gap closes, and the Emini has to go sideways for 5 – 10 bars before the bulls will buy again. That is the risk here. The odds are that the gap between the December close and the November high will close. That means that the Emini will probably trade back below the November high within a few months. However, because there is no sign of a top, the odds still favor higher prices after that pullback.
Possible ioi setup in December
When an outside bar forms in a tight trading range, there is an increased chance of an inside bar next month. This means that December might have a low above the November low and a high below the November high. If so, this would create a 3 month ioi Breakout Mode setup.
Because it would be in a strong bull trend, the odds would favor a bull breakout. Yet, after a 4 month trading range and a 5 month parabolic wedge rally, the bears would have a 30% chance of a major reversal down.
Parabolic Wedge Top
I have written several times over the past few months about a possible parabolic wedge top. November is the 3rd push up in a tight channel since the February low. That means this this is a parabolic wedge rally. It increases the chances of a big reversal down.
Yet, when a parabolic wedge reverses down, it usually pulls back for 10 bars into a bull flag first. Then, the bears get a strong bear breakout below the bull flag. Ten bars on the monthly chart is almost a year. Hence, even if this is a parabolic wedge top that reverses down, it will take about a year before a clear bear trend begins.
Weekly S&P500 Emini futures candlestick chart:
Continued strong bull breakout
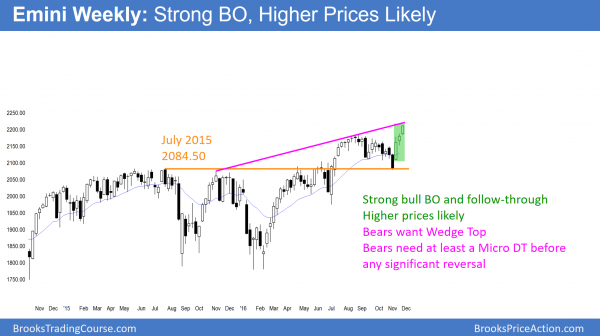
The weekly S&P500 Emini futures candlestick chart had its 3rd consecutive strong bull trend bar this week. The odds are that there will be at least a 2nd leg up after the 1st pullback.
The weekly S&P500 Emini futures candlestick chart had a strong bull trend bar this week. This was the 3rd consecutive strong bull trend bar. It therefore was strong follow-through buying after the breakout above the 3 month wedge bull flag. Because this breakout is strong, the odds are that bulls will buy the 1st pullback. Hence, the bears will probably need at least a micro double top before they can create even a minor reversal down.
While the August to November pullback could be the Final Bull Flag, there is no sign of a top yet. When a breakout is this strong, even a micro double top is a low probability setup for a trend reversal. Traders will not believe that the bears have taken control until there is a strong reversal down.
That reversal can come from a huge bear trend bar, or a series of 3 or more smaller bear trend bars. Because there is no sign of either, the odds favor higher prices. Traders expect the 1st reversal down to be minor. Hence, they know that it will probably become a bull flag that leads to higher prices.
Daily S&P500 Emini futures candlestick chart:
President Trump stock market rally will pull back next week
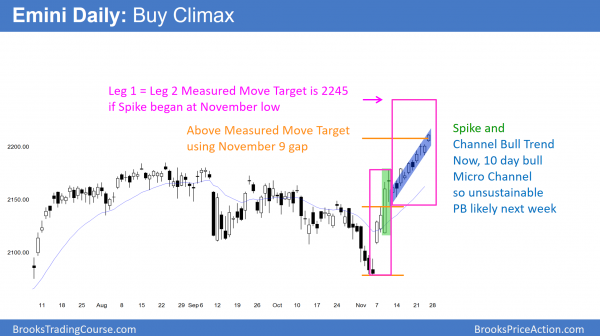
The daily S&P500 Emini futures candlestick chart in is an 12 bar tight bull micro channel. This is unsustainable. Yet, bulls will buy the 1st pullback.
The daily S&P500 Emini futures candlestick chart has not had a pullback in the 12 days since the election. Hence, it is a 12 bar bull micro channel. The 2 days formed a bull breakout. The next 10 have been in a tight channel. This is therefore a Spike and Channel Bull Trend. The stock market breaks below the bull channel 75% of the time. It can do this by reversing down or by going sideways. In addition, there is a 50% chance that the pullback will fall to the beginning of the channel, around 2150.
Micro Channel is a buy climax
Eleven days in a tight bull channel is unusual. Hence, it is unsustainable and climactic. While micro channels can grow to 20 bars, that is extreme rare. As a result, the odds are that the Emini will pull back next week.
A pullback simply means that a day will trade below the low of the prior day. Bulls usually buy the 1st pullback in a micro channel. Yet, they also understand what typically follows. There is usually one more new high over the next several days. Then, the stock market usually begins a pullback.
The minimum goal for the bears is a 2 legged move. In addition, they expect it to retrace at least 50% of the channel, or about 30 points. Furthermore, the pullback usually lasts at least half as long as the rally. Therefore the pullback will probably last at least a week, have 2 legs, and fall 30 points.
Measured Move targets
While most resistance fails, all bull trends end at resistance. It is therefore helpful to know where the resistance is. The Emini is at the top of its tight bull channel. Hence, it is at resistance.
In addition, there is a gap between the November 10 low and the November 8 high. This is therefore a potential Measuring Gap. The target is 2207.50, which the Emini hit on Friday.
Finally, a Spike and Channel rally often pulls back after a Leg 1 = Leg 2 Measured Move. Because the Spike is usually Leg 1, Leg 1 ended with the 2 day rally after the election. Since the Channel is usually Leg 2, it started with the low of November 10. The target is therefore 2208.75. Some computers will use the November low for the bottom of the spike. Their target is therefore up at 2245.
Because there are 3 targets that are within a few points, the probability is greater that the Emini will pull back soon. Yet, the Emini often overshoots targets before reversing. This is especially true when a rally is strong, like this one.
Traders can see the end of the day bar-by-bar price action report by signing up for free at BrooksPriceAction.com. I talk about the detailed Emini price action real-time throughout the day in the BrooksPriceAction.com trading room. We offer a 2 day free trial.
When I mention time, it is USA Pacific Standard Time (the Emini day session opens at 6:30 am PST, and closes at 1:15 pm PST). You can read background information on the intraday market reports on the Intraday Market Update page.


Thank you for your commentary. Happy Thanksgiving.