Monthly S&P500 Emini futures candlestick chart:
Political conventions and the stock market
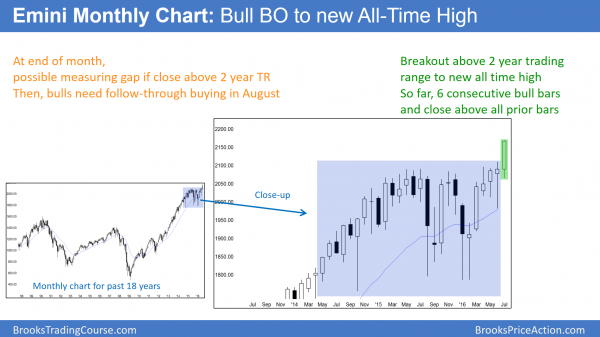
The monthly S&P500 Emini futures candlestick chart has a big bull trend bar in its breakout to a new all-time high. It is the 6th consecutive bull trend bar in a strong bull trend.
Some beginning traders erroneously think that there is a significant link between political conventions and the stock market. There is not. Like any news event, a convention might cause a one day move in the market. However, support and resistance on all time frames are far more important forces. Traders should not give the conventions any thought as they plan their trades.
Strong bull breakout
The monthly S&P500 Emini futures candlestick chart has one week left in the month. This month is forming the 6th consecutive bull trend bar. Most noteworthy, the rally is a strong breakout to a new all-time high.
The importance of follow-through buying in August
Because this month is breaking out of a trading range, August is important. The bulls want to see another big bull trend bar. As a result, it would increase the chances that the breakout would lead to a 300 point measured move up. At a minimum, they do not want a bear bar in August.
The bears always want the opposite of the bulls. They do not mind this month being a big bull trend bar. Their concern now is also August. At a minimum, they need it to have a bear body because that would be an early sign of a possible failed breakout. Their ideal bar would be a big bear trend bar closing on its low and below the July low. While this is unlikely, it would mean that the July breakout was probably failing. The 2 year trading range would then be the Final Bull Flag in a 7 year bull trend.
Most likely, August will be somewhat disappointing to both the bulls and bears. The most common candlestick pattern that confuses and disappoints both is a doji. August will probably have a tail on top. If it is big and the month closes below its midpoint, the bar would be slightly better for the bears. If it is small and August closes above its midpoint, that would be slightly more bullish.
Weekly S&P500 Emini futures candlestick chart:
Strong breakout, but losing momentum
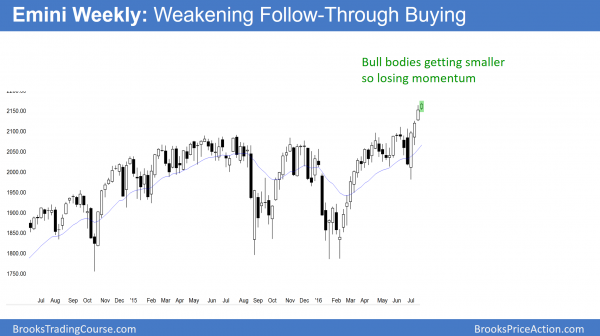
The weekly S&P500 Emini futures candlestick chart has had 4 consecutive bull trend bars. Yet, the bodies are getting smaller, which indicates a loss of momentum.
The weekly S&P500 Emini futures candlestick chart had a small bull bar for its candlestick pattern this week. This is weak follow-through after a strong breakout above a 2 year trading range over the past 2 weeks. Although the prior 3 weeks were strong bull trend bars (big bodies, closes near highs), the bodies have been shrinking. This represents waning momentum. It therefore is a sign that the Emini will probably pull back next week.
A pullback means that next week will trade below this week’s low. The bulls will probably buy the pullback. With the rally as strong as it has been, the odds are that the pullback will last 1 – 2 weeks and become a small bull flag. If so, bulls will buy above the high of the pullback bar, expecting at least one more week in the bull trend.
The bears want next week’s pullback to be a big bear trend bar closing on its low. Instead of just a pullback, they want the pullback to be so big that becomes a reversal. If they can make next week become a bear trend bar closing on its low, they would significantly increase the probability that the breakout will fail and reverse back into the 2 year trading range. While the odds are against this, it would change everyone’s expectation for the coming weeks.
Daily S&P500 Emini futures candlestick chart:
Bull flag in an overbought bull trend
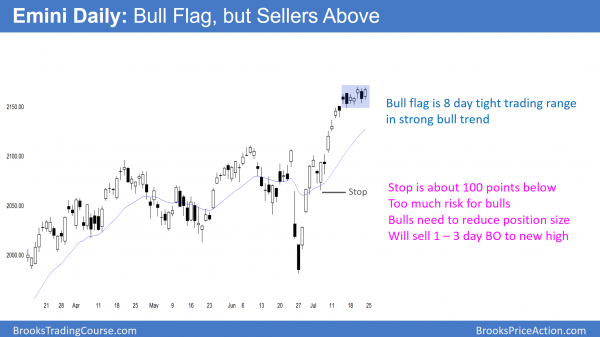
The daily S&P500 Emini futures candlestick chart is trying to resume up after a 7 day bull flag.
The daily S&P500 Emini futures candlestick chart has been in a trading range for 7 days. Last weekend, I said that this was likely to happen. The bulls see this pullback as a bull flag and they therefore expect trend resumption up next week.
The bears see it as a small trading range above a big trading range. That is a type of reversal candlestick pattern. They then hope for a bear breakout below the small trading range and a strong move back down into the 2 year trading range. Hence, they want a failed breakout above the 2 year range. While the odds still favor the bulls because the momentum has been so strongly up for 6 months, the bears have a reasonable case.
Bulls have a wide stop
For the past couple of weeks, I have talked about the problem the bulls have with their protective stop. It is still below the July 6 low, which is about 100 points and 5% below. This is more risk than many institutions will allow. They have to reduce their position size to reduce their risk.
Their profit taking over the past 7 days has created the current pull back. The bulls now need a strong bull breakout to another all-time high. If they get it, they will then move their stop to just below the bull flag of the past 2 weeks. This will greatly reduce their risk.
Bulls need a strong breakout before raising stops
If the Emini got the strong bull breakout and then fell below this week’s higher low, traders would begin to wonder if the bull trend has ended. As long as a bull trend continues to make higher lows, it is intact. Once it falls below a major higher low, the bull trend has evolved into a trading range. It might even have reversed into a bear trend.
If the bull trend resumes up, but not strongly, the bulls will assume that the rally is a bull leg in the ongoing pullback. They will not raise their stops from below the July 6 low. The bulls instead will use the rally to reduce their position size ever further. They need a strong bull breakout to believe that the bull trend has resumed. Only then will they tighten their stops, which will allow them to build their position back up.
Traders can see the end of the day bar-by-bar price action report by signing up for free at BrooksPriceAction.com. I talk about the detailed Emini price action real-time throughout the day in the BrooksPriceAction.com trading room. We offer a 2 day free trial.
When I mention time, it is USA Pacific Standard Time (the Emini day session opens at 6:30 am PST, and closes at 1:15 pm PST). You can read background information on the intraday market reports on the Intraday Market Update page.


