Market Overview: Nifty 50 Futures
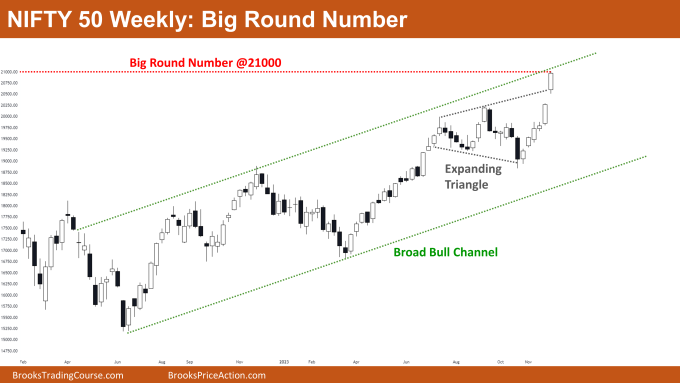
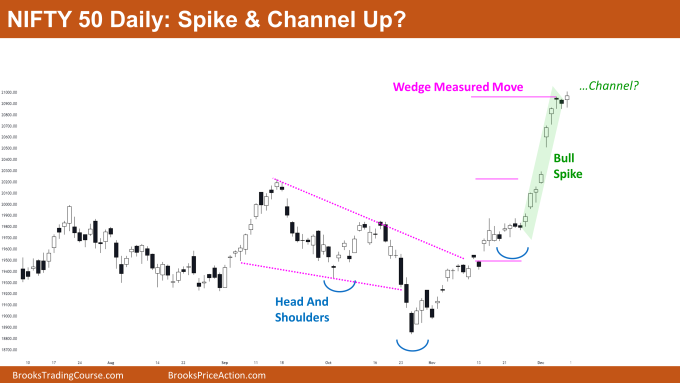
Nifty 50 Big Round Number on the weekly chart. The market is still moving within a strong, broad bull channel after forming another powerful bull bar that closed close to the weekly high. The bull channel’s high and the 21000 mark will both serve as strong price resistance points. Following the announcement of election results, the market gapped up significantly. The daily chart of Nifty 50 has effectively reached the measured move target for the wedge breakout. However, at present, the market is exhibiting an unsustainable bull spike that may eventually transform into a channel, forming a spike & channel up pattern.
Nifty 50 futures
The Weekly Nifty 50 chart

- General Discussion
- Since the big round number and channel high serve as significant resistances, bulls with long swing positions might want to liquidate their positions.
- It is also a reasonable strategy for some bulls to hold off on exiting the market until after a strong bear bar.
- Unless the market forms a strong bear bar or a series of bear bars, bears shouldn’t be selling.
- Deeper into the price action
- The market is trading in a tight bull channel and has broken out above the expanding triangle pattern.
- The upward movement is now almost 90 degrees, indicating that this leg would soon come to an end and either turn into a bear leg or a small trading range.
- The market has formed six consecutive bull bars with bull gaps, increasing the likelihood of a second leg up before a reversal.
- Scalpers can take advantage of this by entering at the beginning of the pullback, on a high-1.
- Patterns
- The market has been moving in a bull channel for quite some time, and it is currently trading close to the channel’s peak.
- In a broad bull channel, buying near the channel’s low and selling near its high can benefit both bulls and bears.
The Daily Nifty 50 chart

- General Discussion
- Bears should wait to sell the market as a bull spike is developing in the market.
- If the bears are able to create strong, consecutive bear bars, bulls may decide to leave the market.
- Bulls may enter the bull trend on a high-1 or high-2 entry bar, as a channel is likely to form following a bull spike.
- Deeper into price action
- The market has created numerous bull gaps, which are drawing the price in like a magnet. Bulls have a greater chance of at least two legs down before a resumption up if they are unable to follow through.
- The market has attained a significant mark of 21000. The market typically exhibits trading range price action when it is trading close to a major level.
- For the next week, traders should therefore anticipate trading range price action.
- Patterns
- The Nifty 50 has effectively moved towards the wedge and head and shoulders pattern’s measured move targets.
Market analysis reports archive
You can access all weekend reports on the Market Analysis page.

