Market Overview: Nifty 50 Futures
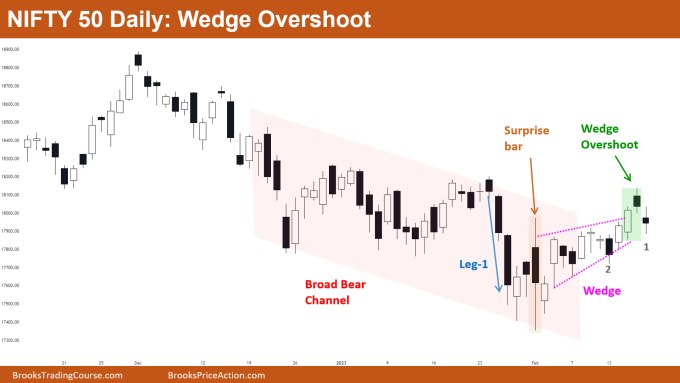
Nifty 50 micro double top on the weekly chart, but since the market formed a bull bar this week, few bears would be shorting below the bar 1 (shown on the weekly chart below). However, given that the market is still moving inside of a bear channel, some bears might be tempted to short below bar 1. On the daily chart, Nifty 50 overshot a wedge top, which was also a bull breakout of a broad bear channel, but it did not receive any follow-through.
Nifty 50 futures
The Weekly Nifty 50 chart

- General Discussion
- In addition to the market being near the high of the bear channel, some bears would short below bar 1 as the Low 1 sell signal bar.
- The market formed a weak bull bar with a long tail above, and the price is trading close to the high of the bear channel, making this a bad time for bulls to buy.
- Deeper into the price action
- Bar 2 was a strong bear bar that closed near the low; as a result, many bears placed their stops at or above bar 2’s high. As you can see, bar 1 did not trade at or above bar 2, indicating that bears are still in short positions.
- The inside bar’s high was a High 2, and many bulls bought at or above this level. However, bar 1 is a poor follow-through bar that may entice some additional bears to sell below bar 1 and some bulls to exit below bar 1.
- Even if bears short below bar 1 they would be looking for a quick exit if the subsequent bar is not a bear bar closing near its low because the previous three bars form a strong bull leg in this bear channel.
- Patterns
- Although the market formed a micro double top inside the bear channel, many bears would not be selling because the last bull leg was so strong.
- Bulls would buy for a measured move up if the market is able to give a bull breakout of the micro double top (i.e., micro double top failure) with a bull bar closing near its high.
The Daily Nifty 50 chart

- General Discussion
- After breaking out of the bear channel and overshooting the wedge top, the market is now retracing back.
- The last two bear bars are smaller and weaker than breakout bars, so some bulls may buy above bar 1’s high.
- As the market broke out of the bear channel, the upper trend line of the channel would now act as a support, and bar 1 has a tail below, not many bears would sell below bar 1.
- Deeper into price action
- The market recently formed a large surprise bar with tails above and below; there is a very high likelihood that the market will move sideways following this kind of pattern.
- Traders should buy low and sell high and scalp instead of taking swing positions.
- Chances of market turning into a trading are about 60% if market starts to trade below the low of bar 2.
- Patterns
- Chances of successful bull breakout of a wedge top are only 25% and 75% of the times market reverses back within few bars.
- Instead of waiting for trends to develop, traders should start trading the market like a trading range (i.e., buy low, sell high) if the market forms strong bear bars in the upcoming week.
- Leg 1 is a very strong bear leg late in the trend and a sell climax; when a sell climax occurs late in the trend and is followed by trading range price action, the likelihood of a trading range is high.
Market analysis reports archive
You can access all weekend reports on the Market Analysis page.


Thank you Rishi. Nice analysis.