Market Overview: Nifty 50 Futures
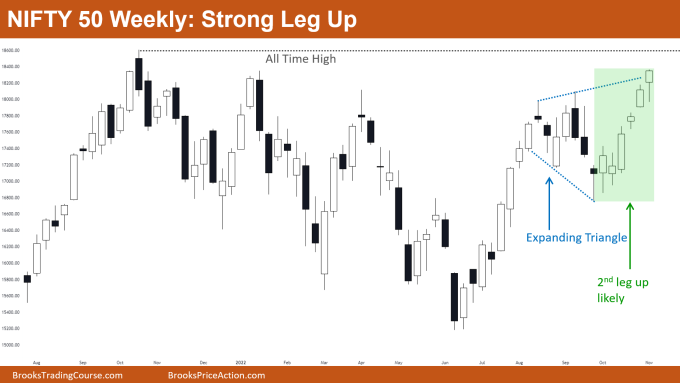
Nifty 50 futures strong leg up on the weekly chart near an all-time high. This week Nifty 50 again gave a bull close and continues the bull micro channel (6-bar bull micro channel). As the current bull leg is very strong there are very high chances that market would get at least one more leg up (bulls would look to buy High 1 or High 2 on a pullback).
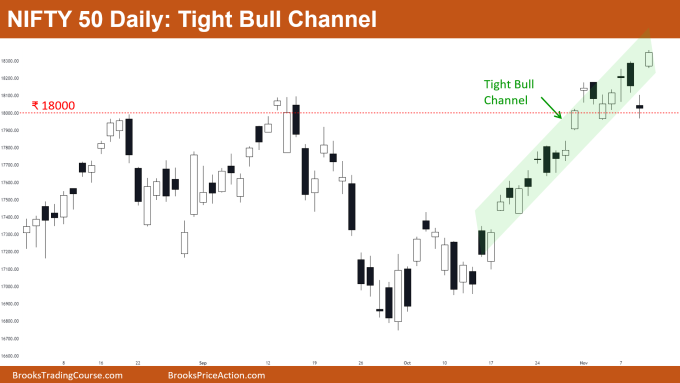
Nifty 50 on the daily chart is forming a tight bull channel (~15 bar tight bull channel) traders should avoid selling until they have strong bull bars.
Nifty 50 futures
The Weekly Nifty 50 chart

- General Discussion
- Market near an all-time high and also at expanding triangle top line, traders should not sell until they see a strong bear bar.
- Some bulls would be buying the close or high of the current bar, as they know there is a high probability of 2nd leg up.
- As the leg is strong and chances of 2nd leg up are higher, many limit order bulls would place buy orders below the current bar (expecting to get another leg up).
- Deeper into the price action
- The current bull leg is very strong as it has open gaps (high of the previous bar < low of the following bar). You may also notice that nearly 3 bars (in the green box) have gapped up (which is a sign of strength).
- The current bar closed near its high in a strong bull leg, due to this bears would not be willing to sell as there is no sign of weakness in the market currently.
- Patterns
- Market forming expanding triangle top near an all-time high which makes some bulls skeptical to buy at these levels.
- All time high is an important resistant level that both bears and bulls know, therefore bears would be waiting to sell on any weakness, and bulls would be looking to book their profits.
- Pro Tip
- Ways you can enter a BULL BREAKOUT:
- The simplest and most aggressive type of entry would be buying at the market as soon as the breakout level is breached.
- If you want more confirmation then bulls can wait for the close of the breakout bar, and then either buy the close or put buy stop order above the bull bar.
- One more way to enter the breakout would be to place a buy limit order below the breakout bar (after it closes), and if it does not get filled on the next bar, then you have to trail the limit order to the low of next bar (Note: If breakout would be very strong then chances are you would miss the trend, but this method helps you to avoid FOMO entries in times of breakouts).
- Ways you can enter a BULL BREAKOUT:
The Daily Nifty 50 chart

- General Discussion
- The daily chart has been in a tight bull channel for the last 15-20 bars and now it’s near an all-time high.
- Bears should not be selling until there are strong consecutive bear bars and bulls can still buy with limit orders below bars.
- Deeper into price action
- While the market was in this tight bull channel it gave many breakouts of swing highs and it left breakout gaps (which is a sign of strength for the bulls).
- In this tight bull channel the market never made strong consecutive bear bars.
- If the market goes sideways after breaching an all-time high then ₹18000 would be an important level (and a high probability that the market would move sideways near this level).
- Patterns
- Markets generally follow a market cycle: Breakout phase → Tight Bull Channel Phase → Broad bull channel Phase → Trading Range.
- Currently, the market is in a tight bull channel phase and chances are that it would convert into a broad bull channel (if and only if the market forms strong consecutive bear bars within a few bars).
Market analysis reports archive
You can access all weekend reports on the Market Analysis page.

