Market Overview: Nifty 50 Futures
Nifty 50 futures micro channel on weekly chart with strong bull close, but near a major swing high, so high probability of Double Top attempt in the coming week. Overall market structure on weekly chart is broad bear channel, so you can always buy low and sell high (broad channels work similar to trading ranges). Nifty 50 on daily chart is in tight bull channel which means it’s very difficult for the bears to make money selling (considering the strength of sell signal bars bears are getting), so only focus on buying near the bottom trend line of the channel.
Nifty 50 futures
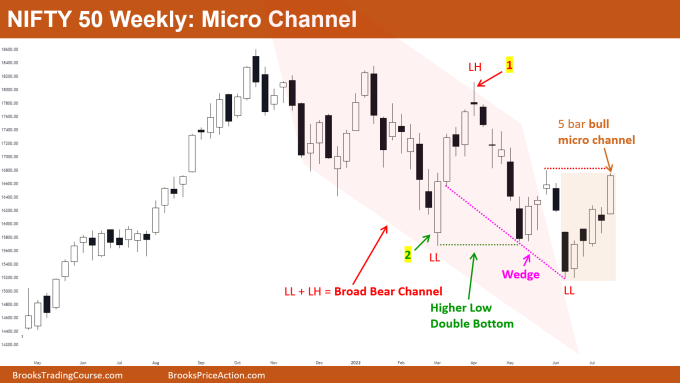
The Weekly Nifty 50 chart

- General Discussion
- Market is near major swing high in the above chart so bulls who bought near previous swing low would be taking profits.
- The current bull leg has a bull bar followed by a bear bar which means there is high probability that this would not lead to bull trend but just a leg in trading range.
- Nifty 50 futures micro channel is forming which means limit order bears not able to make money. So you should avoid selling until getting a strong bear close.
- Deeper into the price action
- Broad bear channels generally form strong bull legs near top of channel which traps the weak bulls and finally market reverses down.
- In broad channels, the market likes to move in 2’s i.e., 2 bull legs and 2 bear legs, so you can take reversal trade after 2nd leg up is finished.
- For higher probability when trading broad channels you can sell on High 2 after 2nd leg up (bull leg) is over, and buy on High 2 after 2nd leg down (bear leg) is over (but this would also reduce the number of trades you would take).
- Patterns
- Bull micro channel nested within the larger broad bear channel.
- Possible Double Top attempt would be seen in the coming week, so some sideways price action is expected for the next week on lower time frame charts.
- Higher Low Double Bottom failure which is always some form of Wedge Bottom and similar for Double Top failure (which leads to Wedge Top).
- Pro Tip
- Always remember when you sell on small bear bar, or buy on small bull bar, your probability of success decreases so you have to keep bigger Risk to Reward profile.
- But when you sell on big bear bar, or buy on big bull bar, your probability of success increases so you can keep smaller Risk to Reward profile
- Let’s take an example: see bar 1 (highlighted in above chart) this is a small bear bar so you have to go for at least 1:3 or 1:4 to get positive trader’s equation.
- But if you buy bar 2 (highlighted above) then you can have positive trader’s equation even with small Risk to Reward profile.
- If you wanted high probability when shorting near bar 1 (highlighted above) then you can always wait for the market to form consecutive bear bars which would improve your probability.
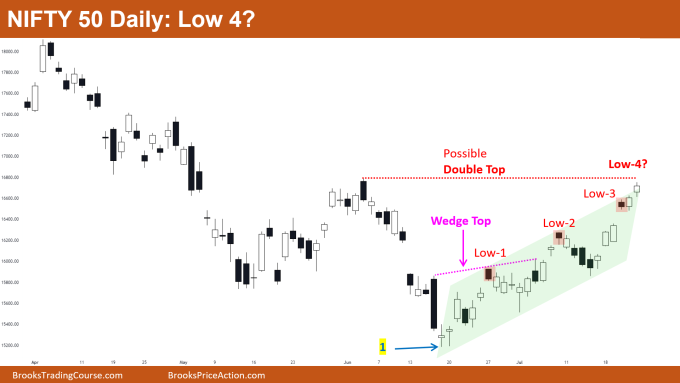
The Daily Nifty 50 chart

- General Discussion
- Nifty 50 in tight bull channel which means not many bears are able to make money so better to buy.
- Wedge Top failed (pink dotted line) so market near that measured move target.
- Market is near a major swing high which means some selling can occur near this area, and also that market near top of tight bull channel.
- Deeper into price action
- Market has formed Low 3 since the last bottom was made by Nifty 50 (bar 1 low marked on chart) but not much selling occurred even on Low 3.
- Many bears who sold low 3 would be scaling in on low 4. So, some selling can be expected on low-4
- There is an open gap before the bar low 3 which but as there is major swing high above higher chances this breakout gap would be filled so this BO gap would be working as a Magnet.
- Patterns
- In general, Low 4 (Low 4, also called consecutive tops attempt) has higher probability to reverse the market than Low 2 or Low 3 signals.
- If you look at current bull channel it is hard to tell whether it is tight or broad. Whenever there is a confusion always trade it like a tight bull channel, that is always buy.
- Bottom line is a possible double top & tight bull channel high & consecutive top. So there would be more bears looking to sell, and more bulls looking to take profits, so can expect at least a leg down before resumption up
Market analysis reports archive
You can access all weekend reports on the Market Analysis page.


RP , suppose the nifty 50 breaks down or moves up then ….what levels are you looking .
Hi Gautam,
the next levels would be the latest Major swing lows and swing highs.