Market Overview: Nifty 50 Futures
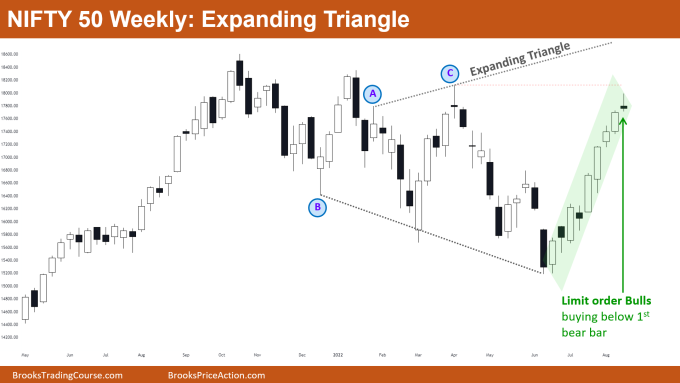
Nifty 50 futures expanding triangle on the weekly chart, the market formed a bear bar after 4 weeks. Bulls expect one more leg up before any reversal, but bulls can book some profits as an expanding triangle top.
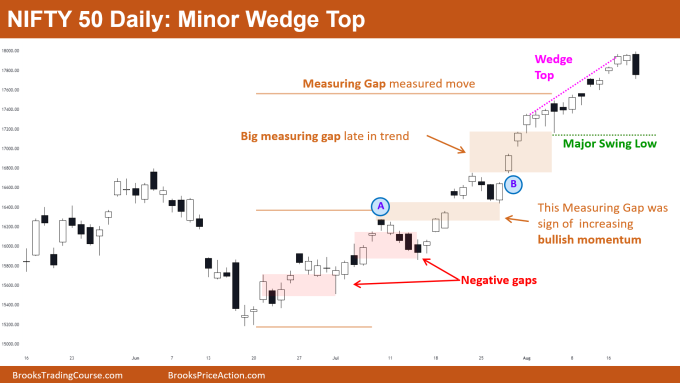
Nifty 50 on daily chart forming minor wedge top which has a low probability of leading to a major trend reversal. Aggressive bears would be selling the outside down bar for another leg down after wedge top, which can also attract some bulls to book profits.
Nifty 50 futures
The Weekly Nifty 50 chart

- General Discussion
- Nifty 50 is still in a strong bull micro channel (as the market never traded below prior bars low).
- The market gave a bear bar after a long time, but this bear bar is not big enough to cause a major trend reversal, with probably more buyers below the bar than sellers.
- 60% chance of 2nd leg up before reversal, so bulls would be looking to buy below the bar, or some bulls would be waiting to buy above a High 1. Or bulls would be buying the close of next bull bar closing near its high.
- Deeper into the price action
- From the last 4 bars market is gapping up, this is a strong sign for bulls.
- But whenever there is excessive strength late in the trend (like in the above chart) then this is less bullish, as this can cause a buy climax rather than the continuation.
- A very strong buy climax near expanding triangle top is not a good sign for bulls. Also, the stop loss for bulls is very big at this point, so this would be attracting some profit taking rather than more buying.
- Stop order bears should only sell after a strong major trend reversal attempt i.e., a strong bear leg.
- Patterns
- Watch for market breaking above a recent major swing high and also breaking below a major swing low.
- Like in the above case market broke above the High of bar A and then also broke below the low of bar B.
- This means now the market has confirmed it’s expanding.
- Once the market gives break above the high of Bar C then an expanding triangle top is confirmed. Sellers would be selling after a strong reversal attempt (remember the lines would never be perfect).
- Pro Tip
- Whenever your try selling a strong bull trend (like the above) ask yourself these questions:
- “Who would be selling here?” and “How can I sell?”.
- Let’s answer the 1st question “Who would be selling here?”.
- In a strong bull trend (as in above chart) the sellers are:
- 1. Bulls who bought while near lower levels and now want to book some profits.
- 2. Aggressive bears selling with limit orders above bars, betting that this is a buy climax.
- Now as we know who is selling, let’s talk about “How can I sell?”.
- The bears are shorting with limit orders (betting that this is buy climax). So if you want to sell this bull trend, then you should be selling with limit orders (and also plan to scale in higher if needed).
- Whenever the trend is strong like this, avoid selling with stop orders and prefer selling with limit orders (but you should be skillful enough to manage the trade correctly).
- Remember: Before selling ask yourself “how other bears would be selling” and before buying ask yourself “how other bulls would be buying”.
- Whenever your try selling a strong bull trend (like the above) ask yourself these questions:
The Daily Nifty 50 chart

- General Discussion
- Market forming an outside down bar after wedge top so can expect 2nd leg down.
- The market is still above a major swing high so still a bull trend.
- The best the bears can get for now is a trading range (until above a major swing low).
- Big measuring gap late in the trend acts like a magnet, as sellers like shorting and betting for exhaustion gap (i.e, buy climax).
- Deeper into price action
- The latest bear bar would not be enough to cause a major trend reversal. Bears at least need a double top before any reversal.
- Some swing bears would be selling the outside bar and place their stop-loss above the bar, targeting the bottom of the last bull leg (which acts as a magnet after buy climax).
- Patterns
- Initially market formed body gaps (negative gaps shown in red). For bears, this meant this bull leg would be a bull leg in the trading range, so bears shorted with limit orders above bar A.
- Once the market started reversing up again on bar B, bulls knew that bears who shorted above bar A were trapped – so bulls started buying.
- This formed the breakout gap which eventually led to a measuring gap.
- Once you see bears are trapped, you have to start buying any bull bar closing near its high, and expect the market to reach a measuring gap measured move.
Market analysis reports archive
You can access all weekend reports on the Market Analysis page.

