Market Overview: Nifty 50 Futures
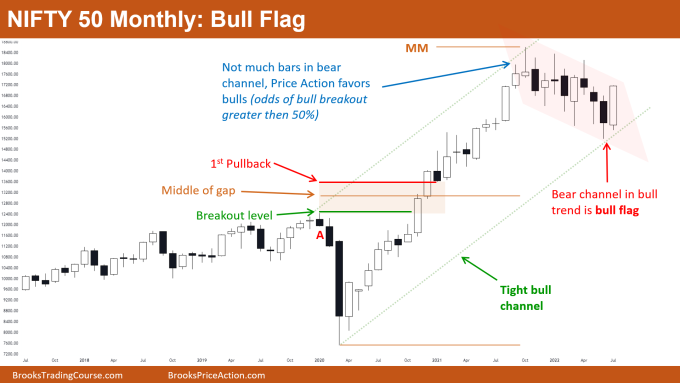
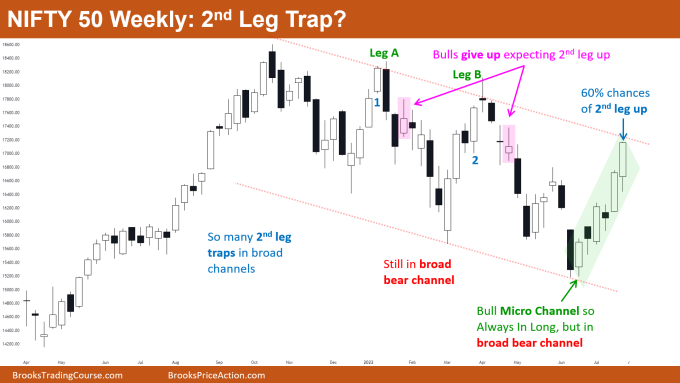
The Nifty 50 gave strong bull close in monthly chart and bulls expect this to be possible trend line of the bull channel. The move down after measured move of measuring gap was very weak to cause bear reversal. Possible Nifty 50 futures bull flag. Nifty 50 in weekly chart still forming lower lows and lower highs which means market is in broad bear channel, and currently trading near the top of the trend channel line, so some profit booking can be expected.
Nifty 50 futures
The Monthly Nifty 50 chart

- General Discussion
- After pandemic Nifty 50 was in tight bull channel. Now market has formed the deepest pullback (red channel).
- This pullback down is very weak, unlikely to result in reversal, so this means the best bears can get is a trading range or bull trend resumption.
- Generally, after a tight bull channel weakens (like here by getting a deep pullback) it has a high probability of converting into a broad bull channel rather than a trading range, so bulls would be looking to buy near the bottom of possible broad bull channel (shown in green dotted line).
- Deeper into the price action
- Let’s focus on that red bear channel, notice how market moved in that channel. There were no strong consecutive bear bars and neither were there strong consecutive bull bars.
- Bear bars were followed by bull bars, also many bars had tails above and below this means limit order traders can make money (this suggests this is just bear leg in trading range).
- This month’s strong bull bar was a High 3 for the bulls, but as this is limit order market, bears would look to sell the high of this bar and bulls would look to book their profits.
- To support bull trend resumption, bulls need one more strong bull bar (i.e., strong consecutive bull bars).
- Patterns
- Market in possible broad bull channel but this channel gets more broader if bulls do not get a good follow-through bull bar in the upcoming month.
- Greater the number of bars added in the bear channel, lesser would be the probability of successful bull breakout and trend resumption up
- Pro Tip
- Measuring gap measured moves are very useful for taking profits, and also are very reliable, but how can you easily identify one?
- First you need to find a major swing high (see Bar A high), I use major swing high because there would be more sellers selling above Bar A high which makes measured move more reliable.
- Second, wait for the breakout above that level.
- Third, wait for the 1st pullback bar and wait for trend resumption up after pullback.
- Fourth. Then create a measured move based on low of the trend to middle of the gap (see the brown box)
The Weekly Nifty 50 chart

- General Discussion
- Nifty 50 is always in long within a broad bear channel and thus has 60% chances of 2nd leg up.
- Market near high of broad bear channel which means there is a 40% chance of this being a 2nd leg trap rather then start of bull trend.
- Deeper into price action
- Look at leg A & B in the above chart, bulls would have been buying 1 and 2 as those are strong bull closes in strong bull leg therefore, they assume there is 60% chances of 2nd leg up
- Look at those pink bars, bulls tried to resume the trend up, but failed to do so and bears know that.
- Once bulls failed to give strong bull close, bears would be placing their stop orders to sell below the weak bull bar. Some bulls would also be exiting below that bar.
- This is known as 2nd leg trap which is common in trading ranges and broad channels.
- Patterns
- Nifty 50 in bull micro channel which is nested inside broad bear channel, so increases the chance of 2nd leg trap.
- Bears should only sell for 2nd leg trap on strong bear close or consecutive bear bar when the leg is this strong.
- 2nd Leg Traps do not lead to trend reversal, rather they can only cause market to form a trading range. Usually the low of trading range is the low of 2nd leg bull trap.
Market analysis reports archive
You can access all weekend reports on the Market Analysis page.


ok