Market Overview: Nifty 50 Futures
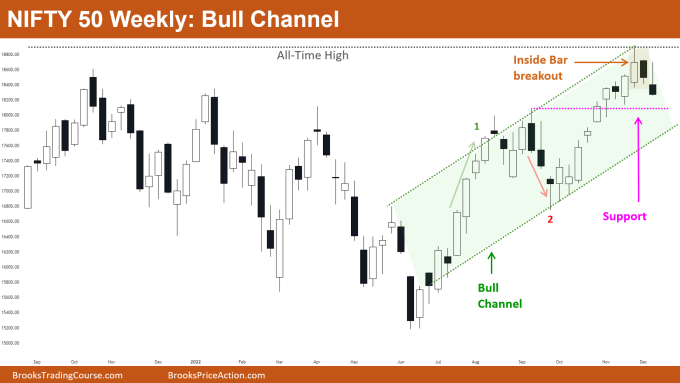
Nifty 50 futures bull channel formed on the weekly chart with also a bear breakout of the inside bar. Nifty 50 is still in a strong bull channel so bears would avoid taking swing shorts and bulls would look to buy pullbacks.
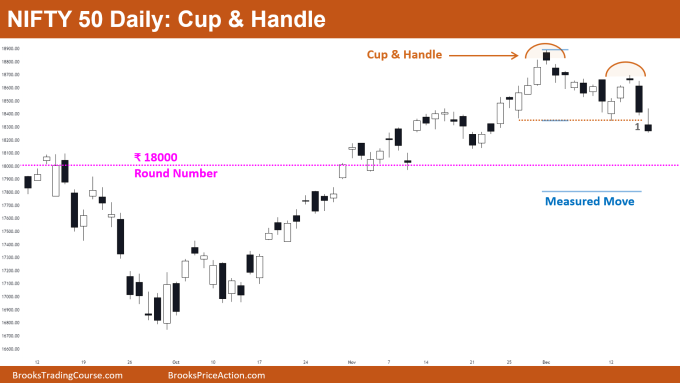
Nifty 50 formed cup & handle patterns on the daily chart and also the market is near a big round number (18000) which would act like a magnet.
Nifty 50 futures
The Weekly Nifty 50 chart

- General Discussion
- Nifty 50 is in a strong bull channel and not giving a pullback to the bull channel bottom line.
- As this bull channel is not very tight, some bears would have shorted near the high of the bull channel and would exit once the market reaches the bottom line of the channel.
- As the channel is strong and bears are not able to make money swinging their shorts, bulls would be buying near the bottom line of the channel.
- Some limit order bulls would also be buying at the support (see pink dotted line in the above chart).
- Deeper into the price action
- After so many bars, the market has now formed 2 consecutive bear bars where the 2nd bear bar closed near its low.
- This would attract more bears to sell at this level (at least for a scalp) and some limit order bulls might avoid buying at the support (pink dotted line).
- Rather they would prefer to wait until the market reaches the bottom line of the channel.
- Patterns
- Nifty 50 recently gave a bear breakout of the inside bar (which also formed an all-time high) and the market gave a good follow-through bar this week.
- The market formed a bear bar closing near low but this bear bar is having a much bigger tail compared to its body. If you look at the bars on the left you would notice that this bar is not a very strong bear bar.
- Pro Tip: How to analyze the strength of a bull channel?
- First look at the above chart (particularly, notice the numbers 1 & 2 here: 1 is the bull leg in the bull channel and 2 is the bear leg in the bull channel).
- There are a couple of points you can check for judging any bull channel:
- How deep is the pullback in this channel?
- How strong is the pullback compared to the trend leg?
- The deeper the pullback the weaker the bull channel and this means bears are also easily making money. Chances of converting the bull channel to the trading range are higher.
- If you see leg 2 (red color in the above chart) you would notice that leg 2 is much weaker than leg 1.
- This is because leg 1 has consecutive bull bars closing near their highs with no pullbacks.
- While leg 2 has only 2 consecutive bear bars with bad follow through on the third bar.
- In general, the weaker the bear leg (in our case leg 2) and the stronger the bull leg (leg 1), the higher the chances that it would lead to a stronger bull channel.
The Daily Nifty 50 chart

- General Discussion
- The market formed a cup & handle top this week and the market gave a strong bear breakout below the neckline.
- The market gave a good follow-through bar after the strong bear bar closing near the low (1) which would further attract more sellers to sell.
- Nifty 50 is now near to the big round number 18000 which would act as a magnet & at support and resistance. So many bears would be holding their positions at least till 18000.
- Deeper into price action
- Nifty 50 is in a strong bull trend but due to the reasons below there is a high probability of the market going sideways to down for a few bars, or even transitioning into a trading range.
- 18000 acts as a magnet
- Bear breakout and good follow-through.
- Measured move down.
- Bulls who bought near the top are trapped so chances are they would be exiting their positions which would further drive the market lower.
- The follow-through bar after bar 1 is closing near its low, and this forms 2 consecutive bear bars closing near their lows i.e., always in short, and with no good reason for bulls to buy at this level the market is expected to go down.
- Nifty 50 is in a strong bull trend but due to the reasons below there is a high probability of the market going sideways to down for a few bars, or even transitioning into a trading range.
- Patterns
- Three main patterns of market forming are:
- Cup & handle top (good for the bears).
- Always In Short (2 consecutive bear bars closing near low).
- 18000 round number below (so acts like a magnet).
- Three main patterns of market forming are:
Market analysis reports archive
You can access all weekend reports on the Market Analysis page.

