Market Overview: Nifty 50 Futures
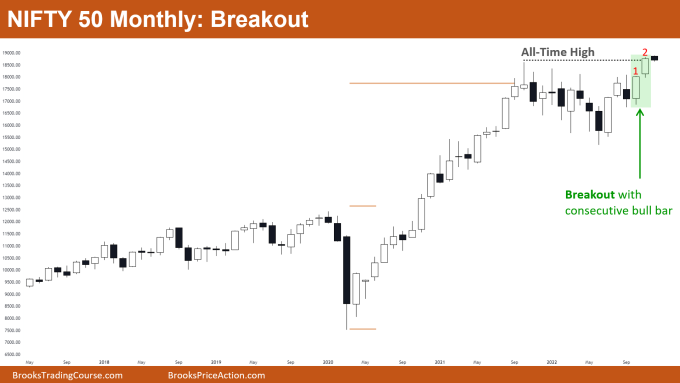
Nifty 50 on the monthly chart gave a Nifty 50 futures breakout of the all-time high level with strong consecutive bull bars confirming that bulls are in control. The market is trading above an all-time high after a year-long consolidation period, and bulls are positive on the current situation and expect to further rally higher from here.
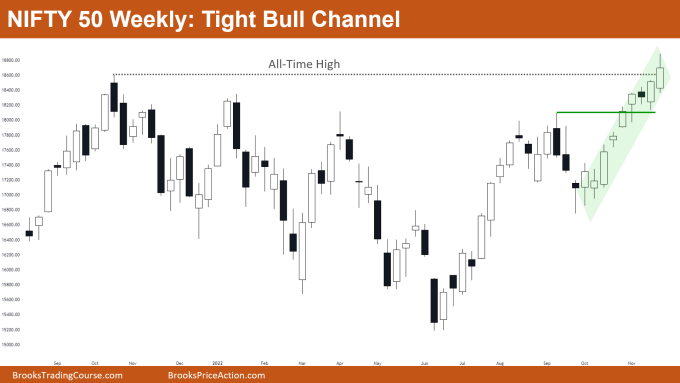
Nifty 50 on the weekly chart is also showing a strong bullish trend. It is still in the tight bull channel which makes it harder for bears to sell while bulls continue to accumulate.
Nifty 50 futures
The Monthly Nifty 50 chart

- General Discussion
- The market gave a strong breakout above an all-time high level and now it’s likely that the market would have good follow-through.
- Traders would keep a close watch on the next bar (after the breakout) as it would confirm whether this breakout would fail or succeed.
- If all market gets a bad follow-through bar then the best bears can get is a trading range and not a reversal.
- Deeper into the price action
- Low of bar 2 (shown in image with red text) did not go much below high of bar 1 and bar 1 closed at its high which is a sign of strength of the bulls.
- If you look at bars on the left you would notice many bars had tails above and below, and bars were getting bad follow-throughs. These were signs of the trading range.
- Due to this many bears would have sold with limit orders at the all-time high, assuming the market would turn into a trading range rather than a successful bull breakout.
- Patterns
- After reaching a measured move, the market spent a year going sideways and now gave a breakout above an all-time high.
- Levels like round numbers, all-time highs, 52 weeks high, etc., are important resistance levels and after the breakout of these traders enter positions only after seeing the strength of follow through.
- Pro Tip
- How can you enter a bull breakout?
- Breakouts occur fast, and due to this it’s very easy to make mistakes while entering one. Traders have different approaches to entering a breakout:
- Entering while the market is having a breakout of some level or some pattern, traders can buy at the market or can put buy stop orders at the breakout level.
- Entering the market after gave strong bull close above the breakout level, traders can buy at the market or can put buy stop orders
- Entering the market on a High 1, many traders prefer entering on the 1st High 1 formed after the breakout.
The Weekly Nifty 50 chart

- General Discussion
- Nifty 50 on the weekly chart is still in the tight bull channel and broke strongly above an all-time high.
- The market has not formed any strong bear bar for 10 weeks, so bears should not plan for selling until they see strong bear bars.
- As this is strong bull leg bulls would buy with limit orders, market orders, or stop orders. This is because they know there is a very high probability that the market would give 2nd leg up before any kind of reversal.
- Deeper into price action
- The tight bull channel consists of many bars which did not even trade below the low of prior bars (bull micro channel). This is a strong sign of the strength of bulls as this shows how urgent the bulls are.
- The breakout bar (of an all-time high) has a tail above which would stop many bulls from buying this breakout until they get some confirmation.
- As bulls know there is a high probability of 2nd leg up, bulls would buy this breakout even if the breakout has a tail on top of it.
- Patterns
- The market finally breached the all-time high level after 12 months. The all-time high level acted as a resistance level, but until now, no sign of weakness is seen in the price action.
- The market is in a tight bull channel so even if the market breaks below this tight bull channel, there are very high chances that the market would convert into a broad bull channel rather than a bear trend.
Market analysis reports archive
You can access all weekend reports on the Market Analysis page.


Thank you