Market Overview: Nifty 50 Futures
Nifty 50 consecutive Doji bars on the weekly chart imply the possible formation of a small trading range rather than a resumption up in the bull channel. Nifty 50 formed a bear flag on the daily chart and the current market is trading inside a triangle (which implies that there are 50% chances of a breakout in either direction).
Nifty 50 futures
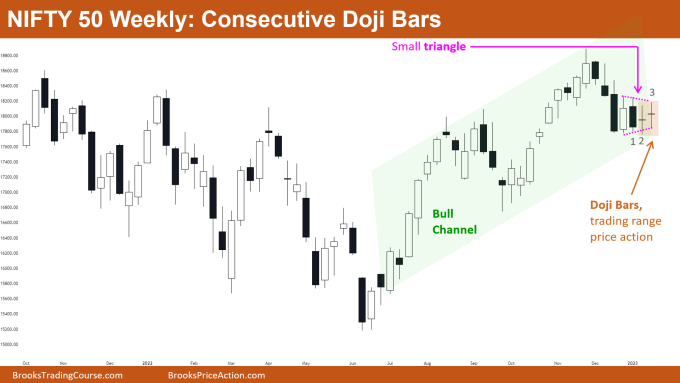
The Weekly Nifty 50 chart

- General Discussion
- The market is still trading near the bottom of the bull channel, with bulls trying to resume up but failing to get a good bull close.
- Bears would avoid selling as the market is still in an up-trend, some bears would be selling if the market gives a strong bear breakout of the bull channel.
- Bulls and bears should be waiting for a good bull bar or bear bar that is closing near its high or low respectively before entering any trades.
- Deeper into the price action
- The market formed two consecutive Doji bars and these generally occur in a trading range phase, so this improves the possibility of the market changing its channel phase to at least a small trading range phase.
- How are bulls and bears buying and selling above bars?
- Bar 1 was a strong bear bar closing near low, but bears did not short below bar 1, instead, the tail on the bottom of bar 2 suggests that bulls bought below bar 1 with limit orders.
- Notice bulls did not buy above bar 2 even if the market is trading at the bottom bull channel (and the market is in a strong bull trend).
- Above mentioned price behavior creates confusion between bulls and bears thus resulting in a trading range phase.
- Patterns
- The market is forming a small triangle which is also a bear flag in a smaller time frame.
- The market is trading inside the bull channel, thus traders should sell only when they see strong consecutive bear bars.
- Pro Tip
- The market generally forms patterns like Doji bars when trading near
- Bottom or top of the trading range
- Bottom or top of channels
- Any important level (like a big round number)
- Near the apex of the triangle (before breakout)
- In the above scenarios, you should be entering a trade only after the market forms a strong bar (or strong consecutive bars).
- If you enter the market before any strong bar is formed then the chances of entering in the wrong direction increases.
- The market generally forms patterns like Doji bars when trading near
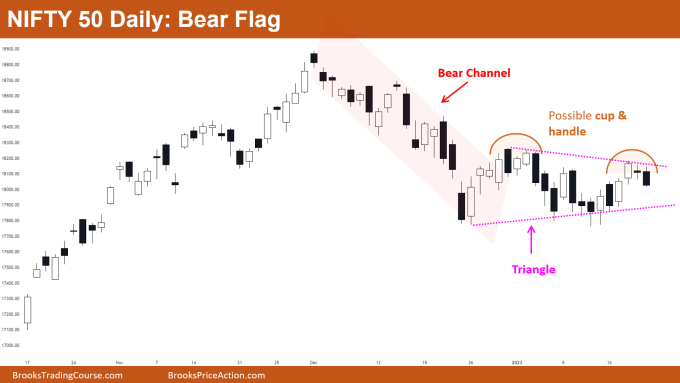
The Daily Nifty 50 chart

- General Discussion
- The market is trading inside a triangle pattern, so both bulls and bears should be waiting for the breakout.
- In general, there are 50% chances of a successful breakout to either side, but as the market is in a bear trend it increases the chances of a bear breakout by a small percentage.
- Deeper into price action
- The market is reaching close to its apex, so traders can expect a breakout soon on either side.
- As the market reaches nearer to the apex of the triangle the candles generally get smaller, this is because the traders (scalpers) take quick exits as there is not much room left (because the lines of the triangle are very close) and they are uncertain about the direction of the breakout.
- The market is also forming a cup & handle pattern, but in the above chart, the height of the handle of the cup is close to the height of the cup. This suggests that it’s more like a trading range than a cup & handle pattern.
- In general smaller the handle (concerning cup) higher are the chances of a successful breakout. This is because a big handle implies that the market is in a trading range and not forming a cup & handle pattern.
- Patterns
- The market was in a strong bear channel and then converted to the trading range, therefore it’s a bear flag.
- A bear flag doesn’t need to have a triangle as a flag. If it was a trading range instead of a triangle even then I would call it a bear flag.
- The market is also forming a cup & handle pattern, which would attract more bears to sell below its neckline.
Market analysis reports archive
You can access all weekend reports on the Market Analysis page.

