Market Overview: Nifty 50 Futures
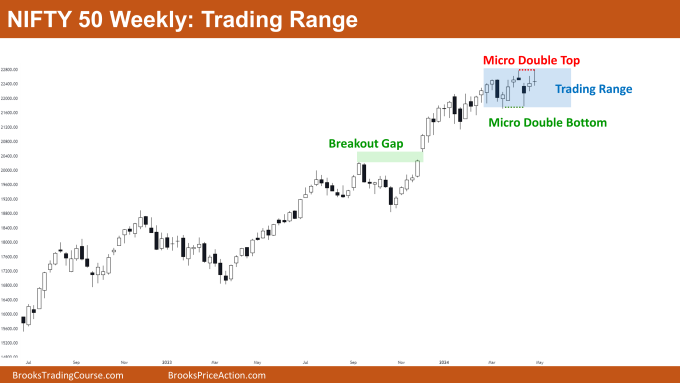
Nifty 50 Bull Micro Channel on the monthly chart. This month, the market closed with a weak bullish pattern, showing a small body and a tail at the bottom. Currently, on the monthly chart, the market is experiencing a breakout phase because of the bullish breakout of the wedge top. Bulls have been able to sustain follow-through bars so far. There’s an observable increase in trading range price action on the monthly chart, indicating a potential pullback (bear leg) in this strong bull trend. On the weekly chart, Nifty 50 hasn’t entered a trading range, noticeable through the formation of a micro double bottom followed by a micro double top. Bulls have also created a breakout gap previously, further strengthening the trend.
Nifty 50 futures
The Monthly Nifty 50 chart

- General Discussion
- The market is currently in a strong trend, with bears struggling to create a substantial downward movement since the bull breakout from the wedge top.
- For traders holding long positions, it’s advisable to maintain those positions until the market shows consecutive strong bear bars.
- Bears looking to sell should wait for a strong bear bar that closes near its low before executing their trades.
- Given the strong bull trend, buying at the current level is a viable option for bulls. The likelihood of a second leg up before a reversal is high, especially considering the strength of the last bull leg.
- Deeper into Price Action
- The probability of a successful bull breakout from a wedge top is typically around 25%. However, in the scenario described, bulls demonstrated a robust breakout followed by significant follow-through bars. This sequence substantially increases the likelihood of success.
- Currently, the Nifty 50 is trading within a bull micro channel. In most cases, when such a channel weakens and experiences a bear breakout, it tends to transition into a bull channel rather than signaling a reversal.
- Therefore, if bears manage to achieve a bear breakout of the bull micro channel, traders should anticipate a minor pullback rather than a complete reversal.
- Patterns
- A bull micro channel is characterized by a specific pattern. It occurs when the low of the preceding bar is lower than the low of the subsequent bar.
- For example, let’s consider Bar A with a low of 100, Bar B with a low of 101, Bar C with a low of 102, and Bar D with a low of 101.
- In this example, the bull micro channel consists of Bars A, B, and C, but not D. This is because the low of Bar D is lower than that of its preceding bar, Bar C.
The Weekly Nifty 50 chart

- General Discussion
- Market is trading inside a trading range, allowing both bulls and bears to profit.
- Note that the trading range is small, making it suitable only for experienced scalpers to structure profitable trades.
- If you lack experience in scalping, consider switching to a lower time frame chart (like a daily chart) to trade within this range.
- Deeper into Price Action
- The market has formed a breakout gap, indicating strength and reducing the likelihood of a reversal in the near term.
- Additionally, this breakout gap could lead to a measuring gap, with a move upward (not shown in the chart).
- Double bottoms and double tops are forming near the same level, signaling that the market has entered a trading range.
- Patterns
- If the bulls manage to achieve a bull breakout of the micro double top, this could result in a measured move up based on the height of the micro double top.
Market analysis reports archive
You can access all weekend reports on the Market Analysis page.

