Market Overview: Nifty 50 Futures
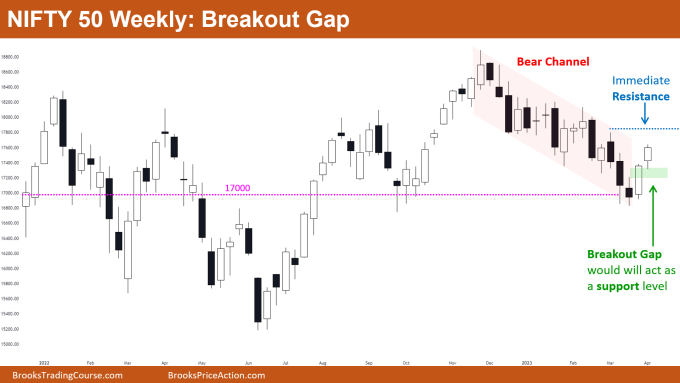
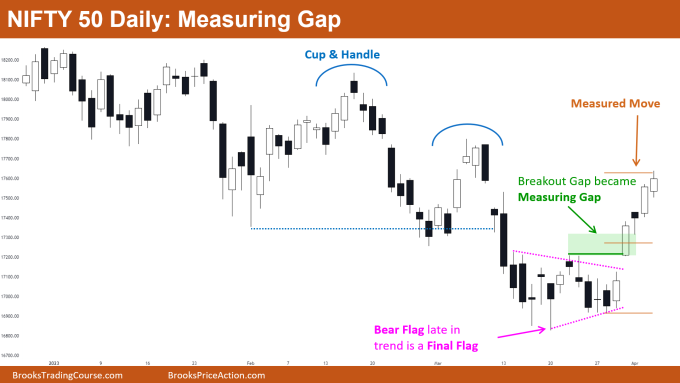
Nifty 50 breakout gap on the weekly chart. The market gave a strong bull bar this week, closing near to its high and at the high of the bear channel (i.e., a resistance). If the market breaks out of the channel, there will be an immediate resistance above the current price. The market formed a breakout gap that later changed into a measuring gap, indicating that the Nifty 50 gave a strong breakout of the bear flag on the daily chart.
Nifty 50 futures
The Weekly Nifty 50 chart

- General Discussion
- The last bull leg had a strong bull leg because many bulls anticipated the move up. Bulls would finally be able to confirm a strong breakout of the bear channel with a strong close above the resistance.
- Strong bull bars prevent most bears from shorting near the current levels, and some strong bulls may book some profits around the current level.
- Bears would sell the market in anticipation of the bear leg in this channel if the next bar was a bear bar that closed close to its low.
- Deeper into the price action
- There is an open breakout gap that demonstrates the strength of the bulls and serves as a support for the price.
- Bears would have an opportunity to sell for a double top bear flag formed near the immediate resistance if bulls fail to give a strong follow-through bar after the breakout.
- Patterns
- The market has created a breakout gap (represented by the green box), which could develop into a measuring gap if bulls are successful in creating a strong follow-through bar.
- If the market breaks out above the bear channel, the likelihood of a large trading range would increase. (according to the market cycle theory).
The Daily Nifty 50 chart

- General Discussion
- Market is forming a strong bull leg on the daily chart. The price is drawn to the measured movement as a result of the measuring gap.
- Until they see consecutive bear bars, bears would hold off on selling the market.
- Bears who shorted the cup and handle breakout and haven’t sold their positions yet are trapped and would be looking for a way out around their breakeven price.
- Deeper into price action
- When bears saw the final flag’s strong breakout, many bears who had shorted the cup & handle pattern should have exited their positions.
- If you look at the bars on the left, you’ll notice that although the market has recently formed significant and strong bull and bear legs. There is also a formation of lower highs and lower lows, which suggests that the market is in a broad bear channel.
- Because the market is in a broad bear channel and has reached the measured move target of the measuring gap, bulls will be taking profits. Bears will try to short the market as soon as it forms a series of consecutive bear bars.
- Patterns
- When a bear flag forms late in a bear trend, the market treats it as a final flag, meaning it should be traded as a reversal pattern rather than a continuation pattern.
Market analysis reports archive
You can access all weekend reports on the Market Analysis page.


I think the bears are still in control and this is a minor reversal only to lead to lower prices