Market Overview: Nifty 50 Futures
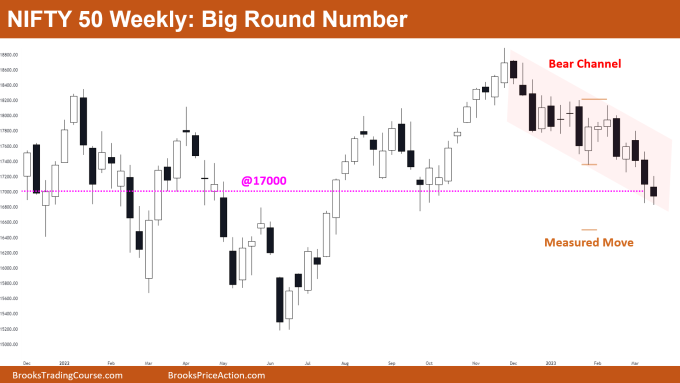
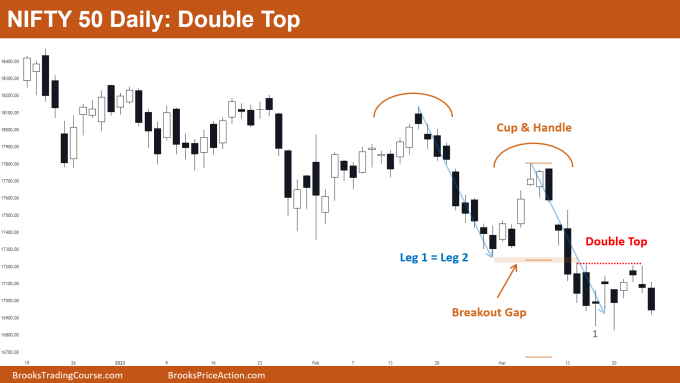
Nifty 50 big round number acting like a support for the price. Nifty 50 on the weekly is still inside the bear channel and present bear leg is the 3rd bear leg in this bear channel. In this week’s trading, the market formed a tiny bear bar with tails above and below the candle. The market this week confirmed the formation of a double top pattern and the daily chart is in a bear trend. However, the market this week was unable to close the breakout gap left by the breakout of the cup & handle pattern.
Nifty 50 futures
The Weekly Nifty 50 chart

- General Discussion
- The market is in a strong bear channel, and no strong bull bars have formed in the past seven weeks. The most recent bull bar, which closed close to its high but wasn’t very large, didn’t get a follow-through.
- Since there are no indications that the market is bullish, bulls would hold off on buying until they observe a strong bull bar closing close to the high.
- Given that the market is trading near the large round number, which serves as price support, as well as the channel’s bottom, some bears would refrain from selling at this level.
- Deeper into the price action
- A big round number attracts the price like a magnet, and consequently, sharp moves and reversals are frequently seen close by.
- There’s an pending measured move of the double top (depicted using the brown solid line) which would also act like a magnet.
- Traders who are already in a position would be quick to exit their trades if the market started to show reversal signs because they are aware that sharp price moves are frequent near big round numbers.
- Patterns
- Usually, the likelihood of a channel breaking out (on either side) increases as the number of legs in the channel increases. A bull breakout of a bear channel has a 75% chance of occurring, while a bear breakout of a bear channel has a 25% chance of occurring.
- As market is trading at the bottom of the channel, bulls generally look for small scalps near these levels above a strong bull bar.
The Daily Nifty 50 chart

- General Discussion
- The market is in a bear trend on the daily chart. The market has many reasons for bears to sell short, including a double top, a cup & handle, and a breakout gap.
- In addition to a pending measured move of the cup & handle pattern, the market is currently trading close to the leg 1 = leg 2 measured move target which is acting like a support.
- Deeper into price action
- On the left, you can see that bulls can form powerful bull legs, but they were never successful in getting a follow-through leg.
- The market attempted to close the bear breakout gap this week, but the bulls were unable to do so, which encouraged more bears to sell the double top.
- The market traded sideways for a few bars after reaching the leg 1 = leg 2 measured move target (at bar 1). This suggests that some bears booked profits at the measured move level.
- Patterns
- Because the market created a breakout gap, traders would anticipate a measured move down.
- The market is currently forming a double top, also known as a double top bear flag, while it is in a bear trend.
- Bulls may attempt to reverse the market from the low of bar 1, but they will need at least a double bottom and strong follow-through to do so.
Market analysis reports archive
You can access all weekend reports on the Market Analysis page.

