Market Overview: Nifty 50 Futures
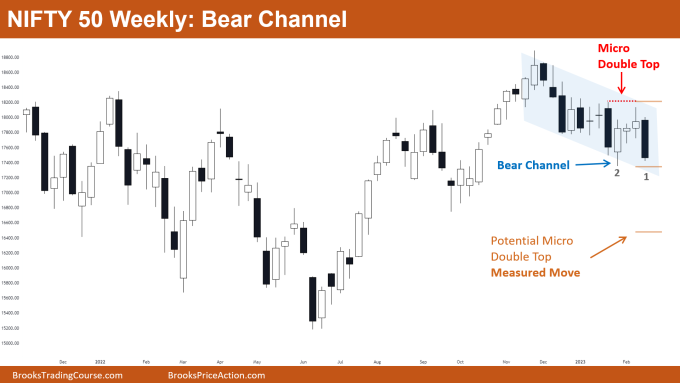
Nifty 50 bear channel on the weekly chart and Nifty 50 is also forming a micro double top pattern. This week’s market showed an impressive bear bar that closed close to the low, possibly attracting some bears to sell and anticipate a micro double top and measured move down.
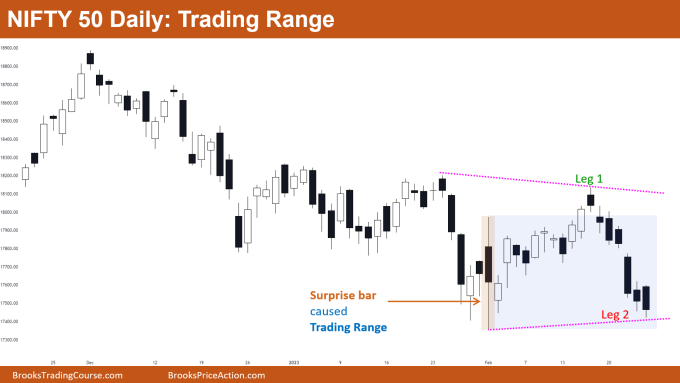
On the daily chart, the Nifty 50 is trading within a potential trading range between the high and low of the surprise bar; some characteristics of a trading range include sharp moves up and down.
Nifty 50 futures
The Weekly Nifty 50 chart

- General Discussion
- With stop orders and targets for the potential micro double top measured move down, some bears would be shorting at the low of bar 1.
- Because the market is trading at the bottom of the bear channel, some bears would not sell at the low of bar 1.
- The market has experienced a lot of trading range price action over the past 10 bars, which has led some bulls to place limit orders to buy at the low of bar 2.
- The probability of a successful bear breakout of a bear channel is only about 25%, which results in a positive traders equation, giving bulls another reason to buy with a limit order below bar 2.
- Deeper into the price action
- If you were to look at the last ten bars, you would see that many of them have small bodies and tails above and below.
- Other signs of a developing trading range include large, powerful bear and bull bars not getting good follow-through.
- There is less chance that the market will reach the micro double top measured move down. The likelihood of a bear channel successfully breaking out is typically around 25%, and there is a 75% chance that it will do so within a few bars of the breakout.
- Patterns
- The market is currently trading within a narrow bear channel; in a bear channel, bulls prefer to buy with limit orders close to the low, or the channel’s bottom trendline.
- A small trading range can be anticipated by buyers if the next bar the market forms is a bull bar. This is because strong bear bars have followed bull bars in the previous 10 bars, and bear bars have not received good follow-through.
The Daily Nifty 50 chart

- General Discussion
- Since the market is currently trading close to the surprise bar’s low, which is shown in the above chart and has a very long tail at the bottom, limit order buyers are expected to be present.
- Leg 2 is a very strong bear leg, and some bears believe the market will form a second leg down. These bears may sell at a Low 1 in anticipation of a second leg down.
- Deeper into price action
- As you can see, legs 1 and 2 both have strong sharp moves up and down, and subsequent sharp moves on either side typically result in a trading range.
- The daily chart is currently in a downtrend, but if strong bull legs like leg 1 start to appear, this will eventually cause the bears to lose interest in selling the market and draw more bulls to buy it – turning it into a trading range.
- Patterns
- Big surprise bars that occur late in a trend typically have a higher likelihood of creating a trading range. In the example above, these chances are increased by the surprise bar’s lengthy upper and lower tails.
- The likelihood of a large triangle pattern (shown by the pink dotted line) is higher if bulls are successful in pushing the market higher from its current price.
Market analysis reports archive
You can access all weekend reports on the Market Analysis page.

