Market Overview: NASDAQ 100 Emini Futures
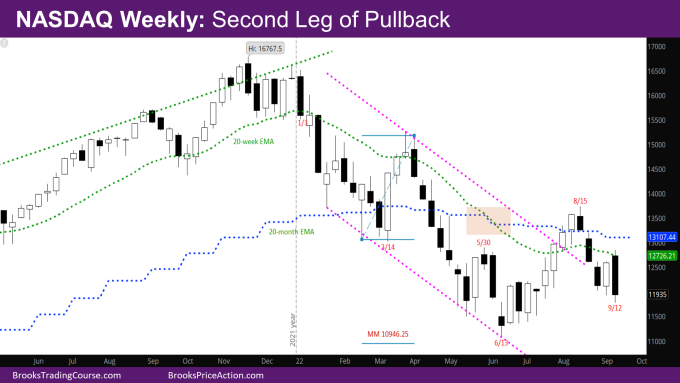
The NASDAQ Emini futures market resumed the second leg of pullback by going above last week’s high and closing below last week’s low – an outside down bar.
As was mentioned in last week’s report, sellers were expected above last week’s high, and they came in at the weekly exponential moving average (EMA) and at 50% retracement up of the pullback.
NASDAQ 100 Emini futures
The Weekly NASDAQ chart

- This week’s Nasdaq Emini candlestick is an outside bear bar.
- This is the second outside bar after the outside bar last week, referred to as an outside-outside (OO) bar – this is an expanding triangle (ET) – the market is reversing at the bottom of a bar, making a new high, and then reversing at the top making a new low.
- The next logical move is for the ET to reverse up again unless there is a breakout below the triangle.
- The market is also back in the tight trading range (TTR) from June-July.
- The market retested the high of the signal bar from 6/13 at 11794.25. Past reports had said that it is likely for the market to test it, since it was a bear signal bar, and reversals from such signal bars are usually minor.
- Given the strength of the first leg of the pullback from the August high, its likely the bulls will need at least two small legs sideways/down – a wedge bull flag with a good-looking bull reversal bar around the same level as the 6/13 reversal bar. This could then lead to a second leg of the move up in July.
- The monthly chart also requires going sideways for a couple of months, create buying pressure before the bulls can start a bull leg up.
- The other way for the bulls to quickly reverse is to have a bull outside bar sometime in the next couple weeks and then break up strongly from that – at that point the bears would have had two failed attempt to go down.
- The bears would like a double top (DT) bear flag with May high, with the neckline around July low, and a measured move (MM) down. This is less likely.
- More likely, bears will need a wedge bear flag between the August high and March high, to then have a leg down corresponding to the strong move down in May.
- This wedge bear flag could take the rest of the year to form, and the leg down from there corresponding to the leg down in May could happen early next year.
- Minimally, bears would like to make their target at the MM down of the February-March double bottom (DB) on monthly chart with target at 10946.25. This is right around the low of the November 2020.
- The market came to within 70 points of this target in June. This is still a viable target.
The Daily NASDAQ chart

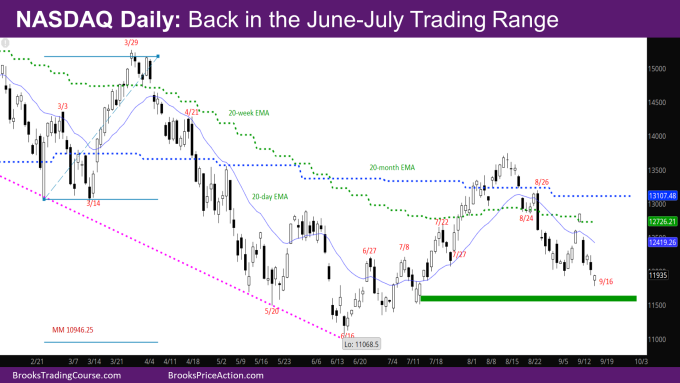
- Friday’s NQ candlestick is a bull reversal bar with a tail at the bottom.
- This week is a steep leg down so likely will lead to another leg down.
- The market gapped up on Monday above the weekly EMA and ended a strong bull bar.
- It looks like the bulls who had earlier bought the weekly moving average on 8/24 and trapped by the big bear bar of 8/26, sold when the market reached their price on Monday.
- Tuesday gapped down a lot and closed on its low, reversing most of last week.
- The next reasonable area of support is the green zone drawn on the chart.
Market analysis reports archive
You can access all weekend reports on the Market Analysis page.

