Market Overview: Nasdaq 100 Emini futures
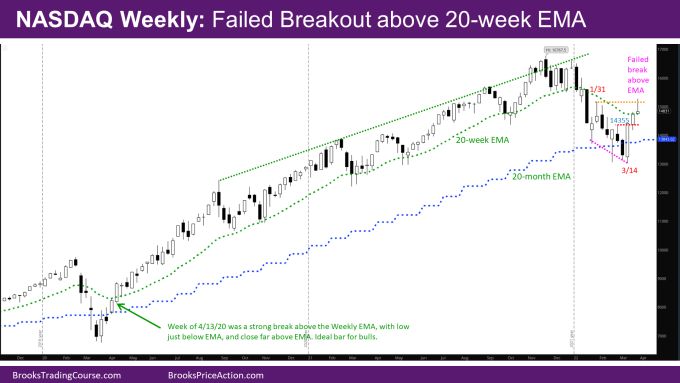
This week’s Nasdaq Emini candlestick is a Low 2 sell signal at the weekly EMA, but with a bull body. It essentially is a failed breakout above the 20-week EMA. The week started strong, going above the swing lower high of week of 1/31, but the last three days of the week were bear days causing the week to close near the open with a big tail on top. This will likely cause next week to test below this week’s low. It is likely the next few weeks will be sideways between the weekly and monthly EMA.
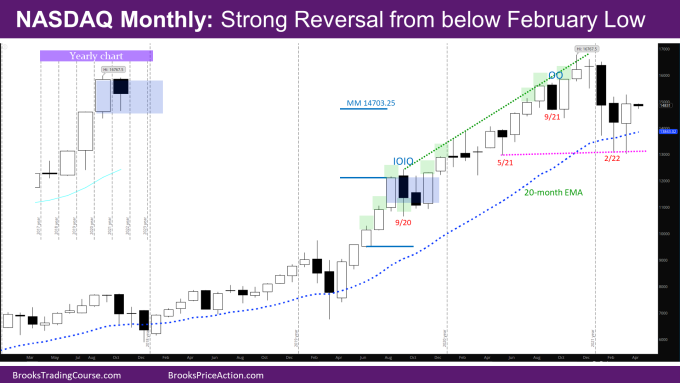
The March month reversed strongly from the 20-month EMA after a 4-month pullback that started in December. The March month candlestick is an outside bull reversal bar with a tail on top. It is also a micro-DB with February so the market should go above the March high to see if there are sellers or buyers.
Nasdaq 100 Emini futures
The Monthly Nasdaq chart

- The March month Nasdaq candlestick is an outside bull reversal bar with a tail on top. It is also a micro-DB with February. The Emini will likely go above March to test how high it can go before sellers come in.
- The bulls did not want March to be a third month bear bar, and they accomplished that with a strong reversal.
- The NQ monthly chart has been in a small pullback trend and in a tight channel since September 2020 after the breakout/spike in June-August 2020 above the pre-pandemic high.
- Most of the pullbacks in the past 1.5 years have been a month, and below bull or doji bars, which have been bought. There have been couple of months that are OO bull bars with bear inside bars, which represent strong bulls.
- Another sign of strength for the bulls is that there have not been two consecutive bear closes below the EMA going back to at least 2010. Even the 30% drop from the pre-pandemic highs could not create a bar closing below the EMA.
- Until the bears can have consecutive bars closing below the monthly EMA, the best they can get is a trading range.
- The market maybe in the process of forming a bigger trading range as evidenced by the two-month pullback in September, October 2021 and now a four-month pullback since December. However, January and February represent the 1st break of this year long channel, so likely will fail and lead to higher prices in the upcoming months.
- In terms of what is possible for the rest of the year, and the next year, see the inset yearly chart. One possibility is inside/sideways bars for this and next year like the monthly chart in August-October 2020, setting up a breakout mode on yearly chart.
The Weekly Nasdaq chart

- This week’s candlestick on the weekly Emini chart was a sell signal bar near the 20-week EMA, but with a bull body. The bulls did the minimum of having a close above the EMA, but with a long tail on top. This is also a sign that we are still likely in a trading range between the Weekly and monthly EMA.
- In a trading range, it’s common for the market to go above resistance and reverse, as well as go below support and reverse. The market was in the bear leg of a trading range in January through early March and is likely in the bull leg of the trading range for the past 3 weeks.
- The bulls did their part of going above the previous swing high of the week of 1/31. A close above that high would have been bullish, but that did not happen, leading to the bulls being disappointed.
- As strong as the reversal was in the week of 3/24, the following week was a much smaller bull bar closing right at the weekly EMA. In a trading range, big bars usually lead to more selling (especially disparate sized bars). This coupled with the price action this week lends to sideways to lower move for the next few weeks.
- A likely target on the lower side is the high of the week of 2/28 at 14355. That high was a reasonable Limit Order sell on the way up, and hence bears selling that should make money.
- If this week had closed on its high, it would have mimicked the week of 4/13/2020 highlighted on the chart, where the low was near the EMA and the close far above the EMA. It would have then led to higher prices.
- More likely, the market will go sideways till the weekly and monthly EMAs come even more closer, until there is a better buy signal bar (the previous buy signal bar in the Week of 3/7 was a bear bar), or a higher low MTR.
Market analysis reports archive
You can access all weekend reports on the Market Analysis page.


Great! Even NQ analysis is here. Support!